In this Episode
Emissions of greenhouse gases are rising dramatically worldwide, but it can be challenging to grasp just how much we are emitting, and where those emissions come from. Here we break down how much we are emitting in total, by country and region, and by economic sector. We also discuss the relationship between key economic and demographic variables and greenhouse gas emissions.
Related Media:


Research Ep 1
Net-Zero by 2050
Pledges to achieve “net-zero” emissions are proliferating from companies and countries alike. However sincere these commitments may be, they rarely include specific plans to achieve that ambition. The Net-Zero America Report from Princeton Universi


Climate Now: Aug 9, 2021
Carbon Dioxide Removal with Roger Aines
How do we reach global net-zero emissions by 2050, when there is almost no chance of completely ending our dependence on fossil fuels by that time? The solution will require Carbon Dioxide Removal (CDR) – a host of natural and technological techniques for dr
Episode Transcript
Human greenhouse gas emissions have already caused 1 degree Celsius or 2 degrees Fahrenheit of global warming[1]. And we’re on track to reach 1.5 degrees Celsius or 3 degrees Fahrenheit by 2030[2]. In order to curb our greenhouse gas emissions, we have to understand three things:
- What are we emitting? And how much of it?
- What are the sources of those emissions?
- What are the underlying drivers of emissions?
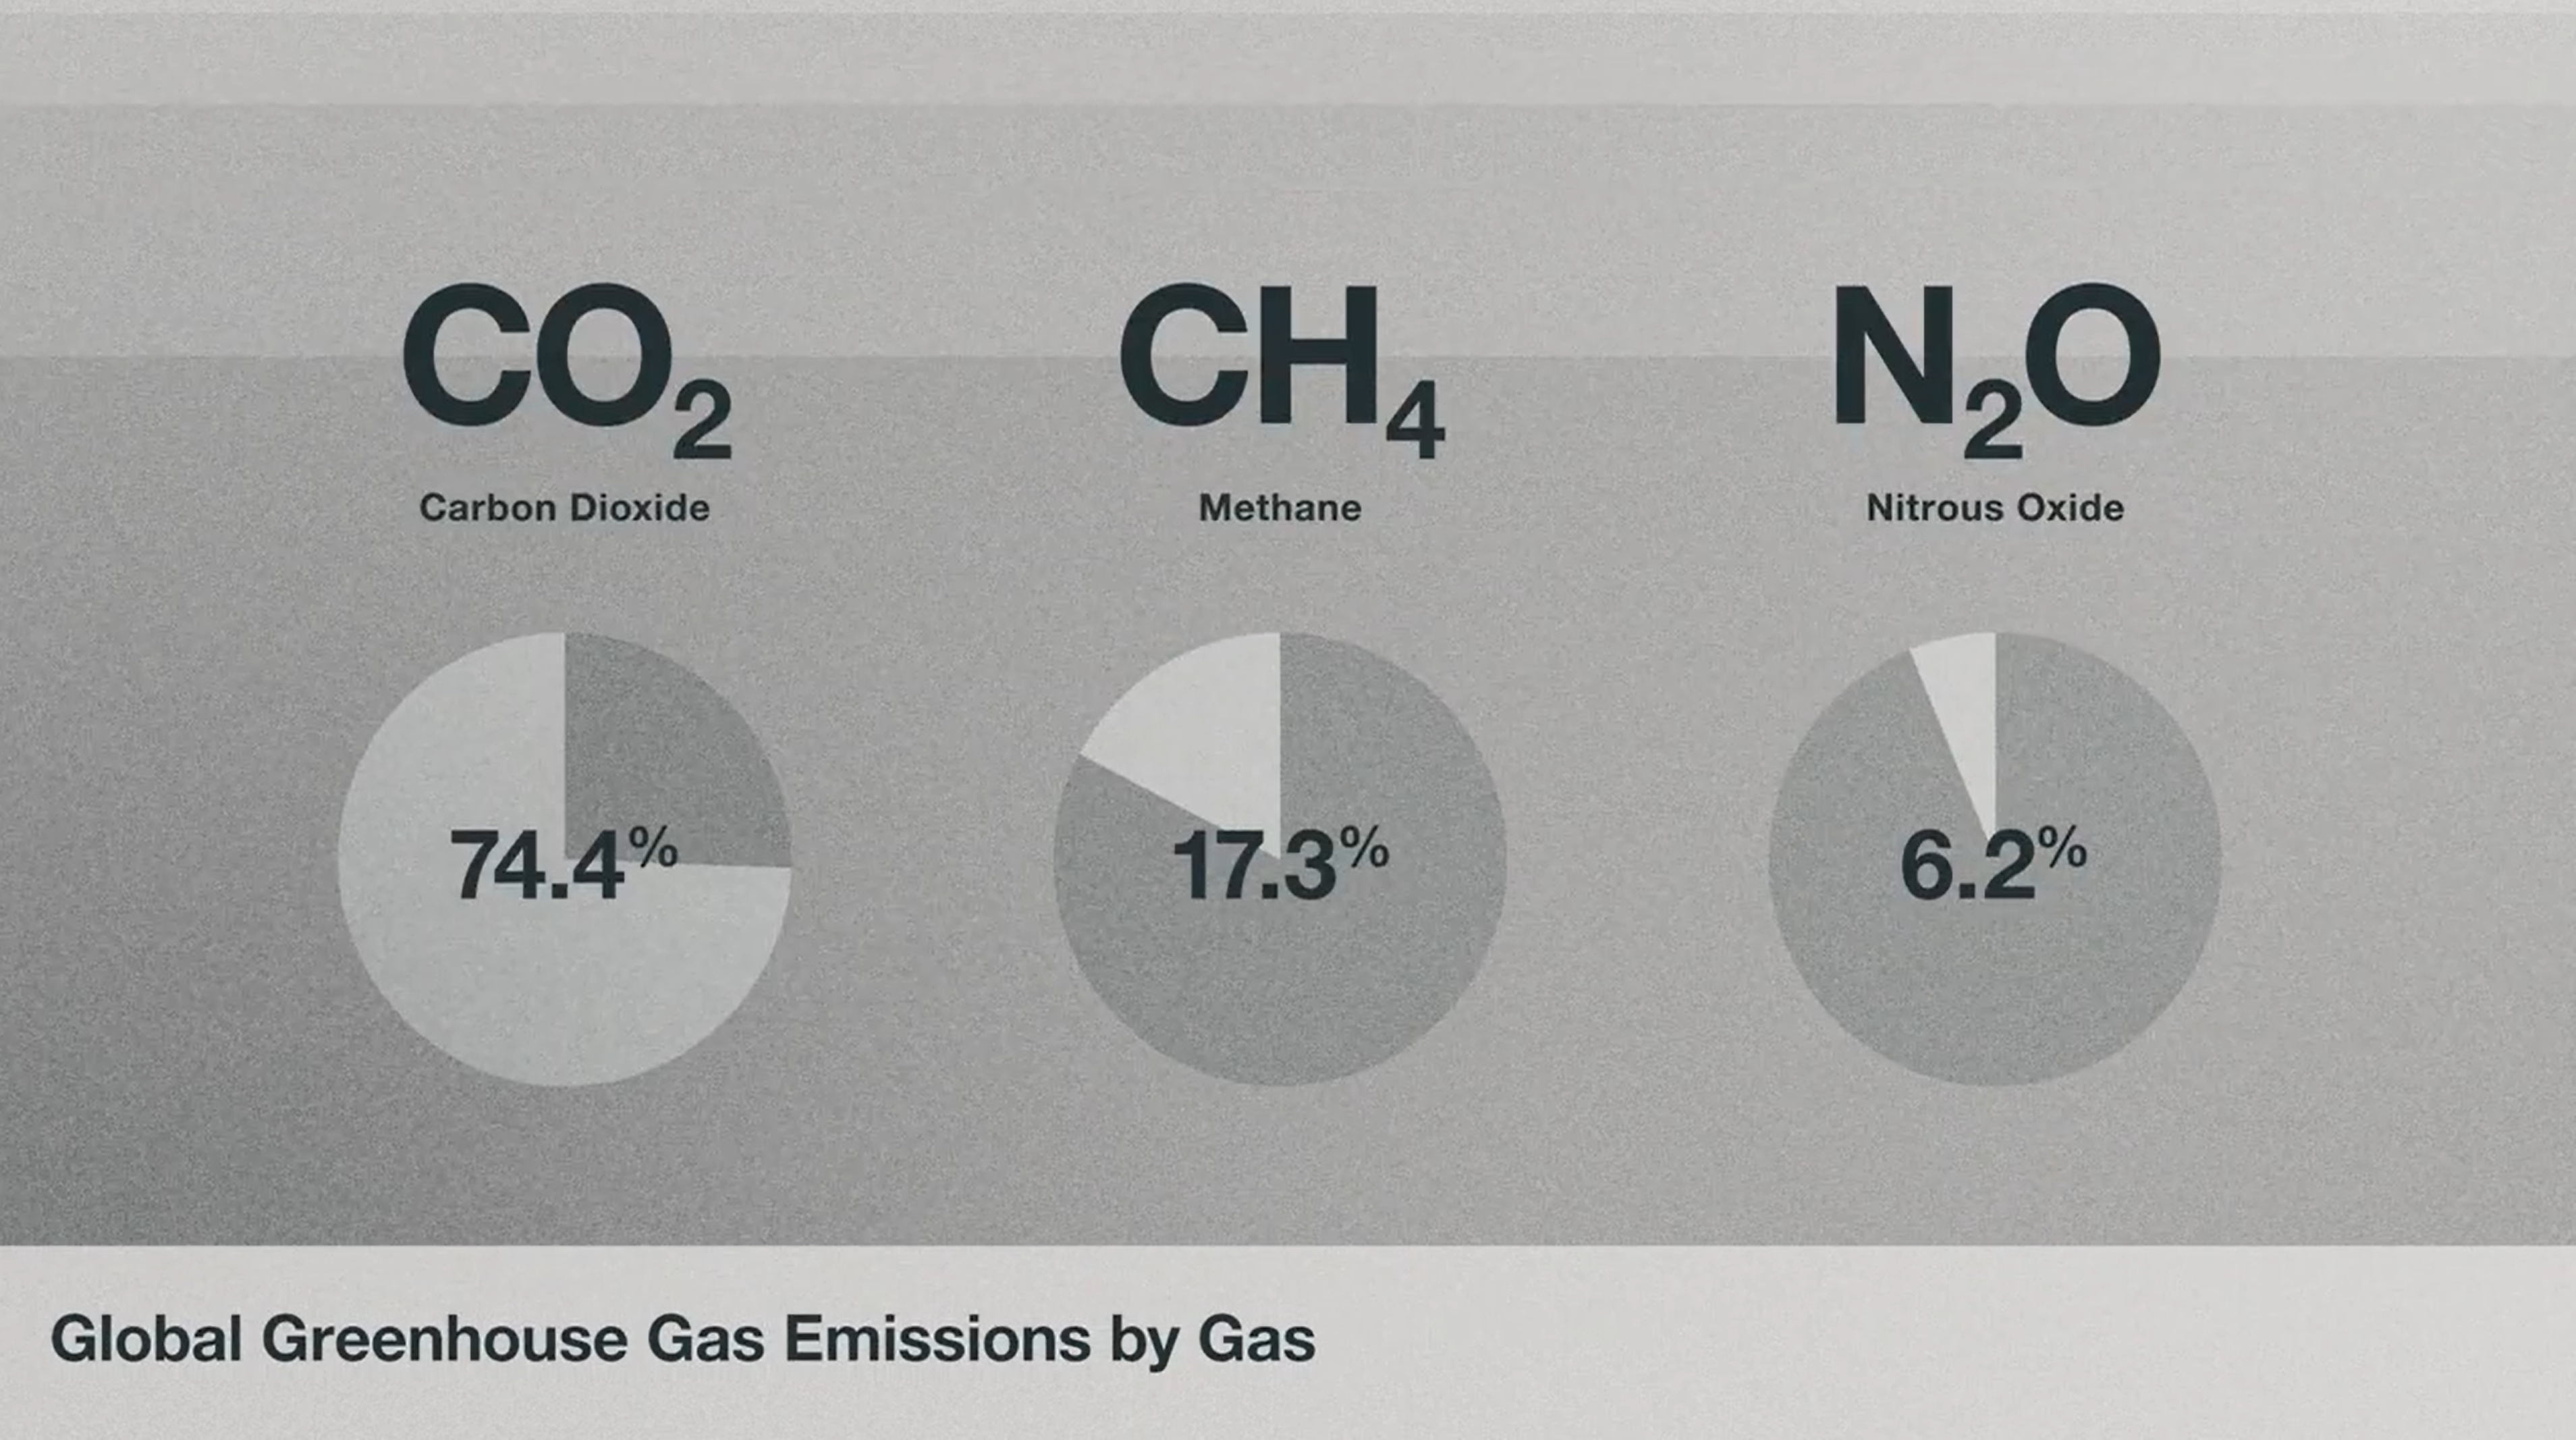
So, number one, what are we emitting and how much? Greenhouse gas emissions include many different gases, such as carbon dioxide, methane, nitrous oxide, chlorofluorocarbons and others[3]. But CO2 makes up by far the largest share of the total. In 2019, CO2 emissions reached 38 gigatons CO2, a staggering weight. And that’s just CO2. If we count all greenhouse gases, 2019 total emissions reached 52.4 gigatons of CO2 warming equivalent, which is abbreviated GtCO2e[4].

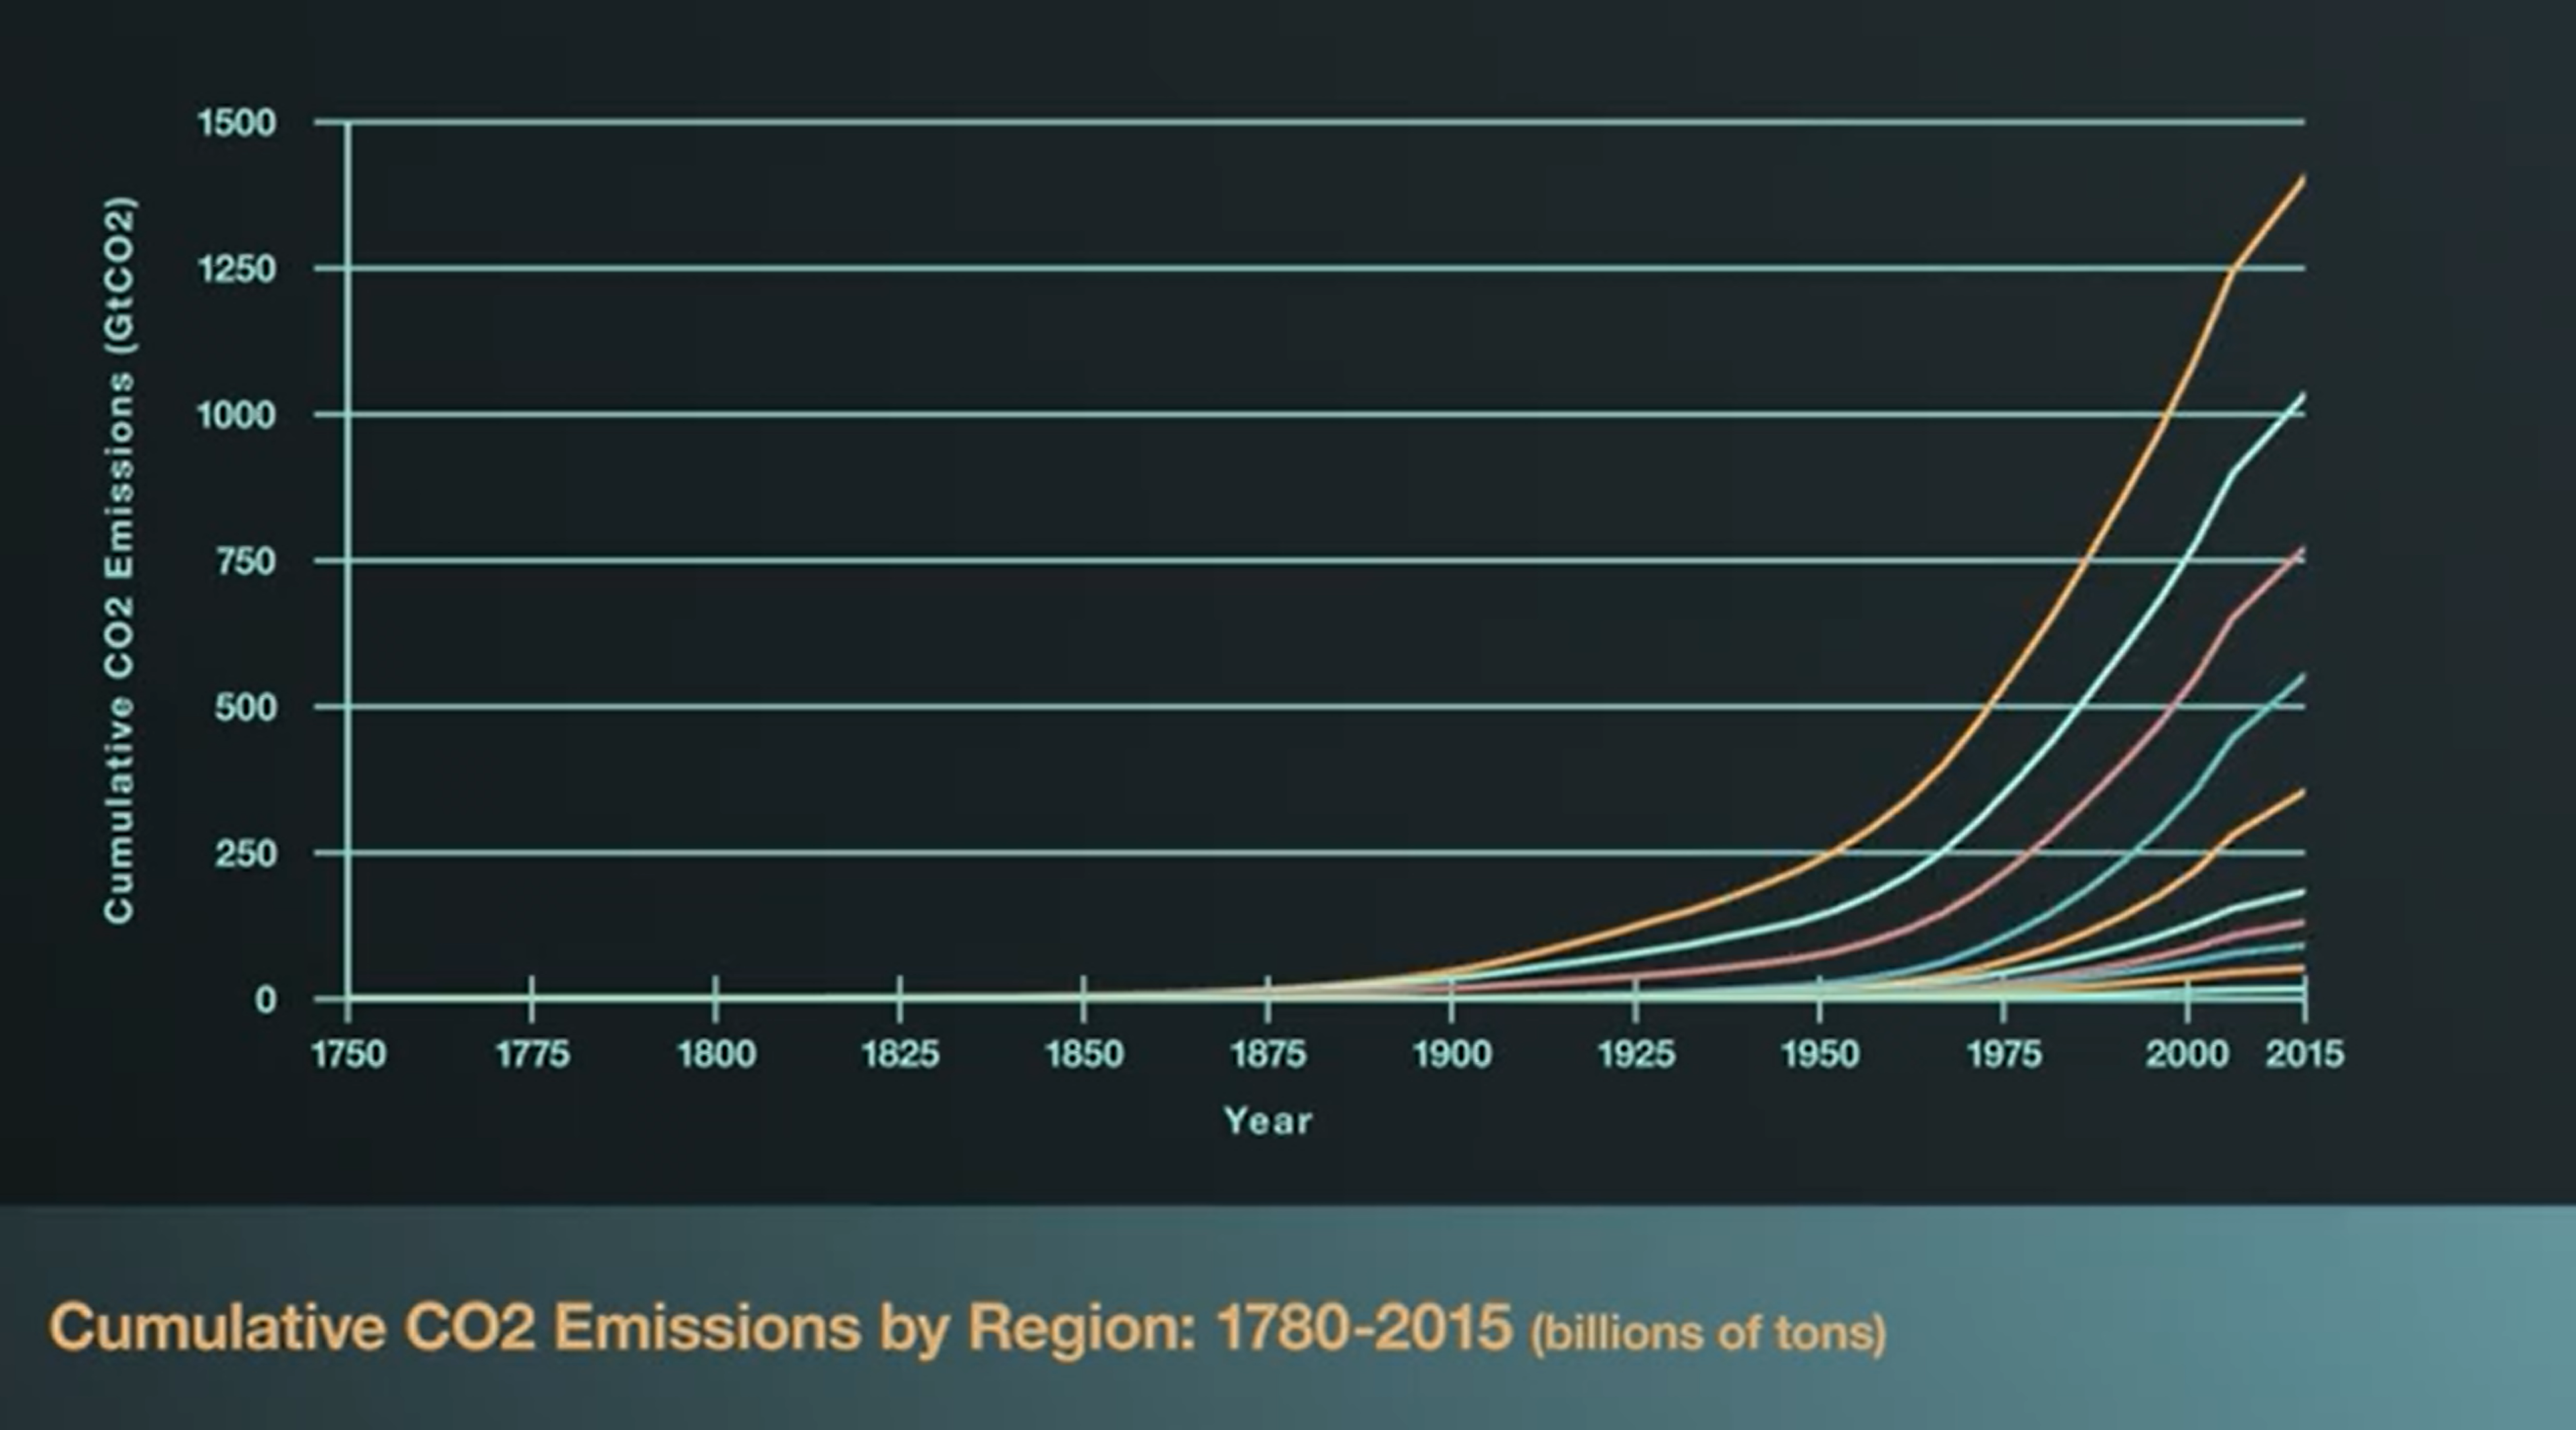
Emissions reached record highs in 2019, but it’s important to understand that the warming effects from greenhouse gases do not depend on how much we release in any given year or even how much we’ve released over the last five years, because CO2 remains in the atmosphere for hundreds, if not over a thousand years[5]. So we’re living with the cumulative effects of the greenhouse gases we have released since the industrial revolution. And that total is a staggering 1.5 trillion tons of CO2[6]. And despite the urgent need for rapid decarbonization, the amount of greenhouse gases that we release each year is only growing and growing very, very quickly.

We can look at this skyrocketing number through a couple of different lenses. Number one, by country. It’s clear that the vast majority of emissions come from just a few countries. The top four emitters, United States of America, EU plus the UK, China and India, have contributed about 55% of total emissions over the last decade. If you expand that group to the G 20 members, you get to about 78%[6].
But the largest recent emitters are not the same as the countries that have admitted the most in total. The US and the EU have contributed just under 50%, or 25% and 22%, respectively, of cumulative global emissions. China has contributed 12.7%, and India falls to sixth place on this list behind the US, the EU, China, Russia, and Japan[6].
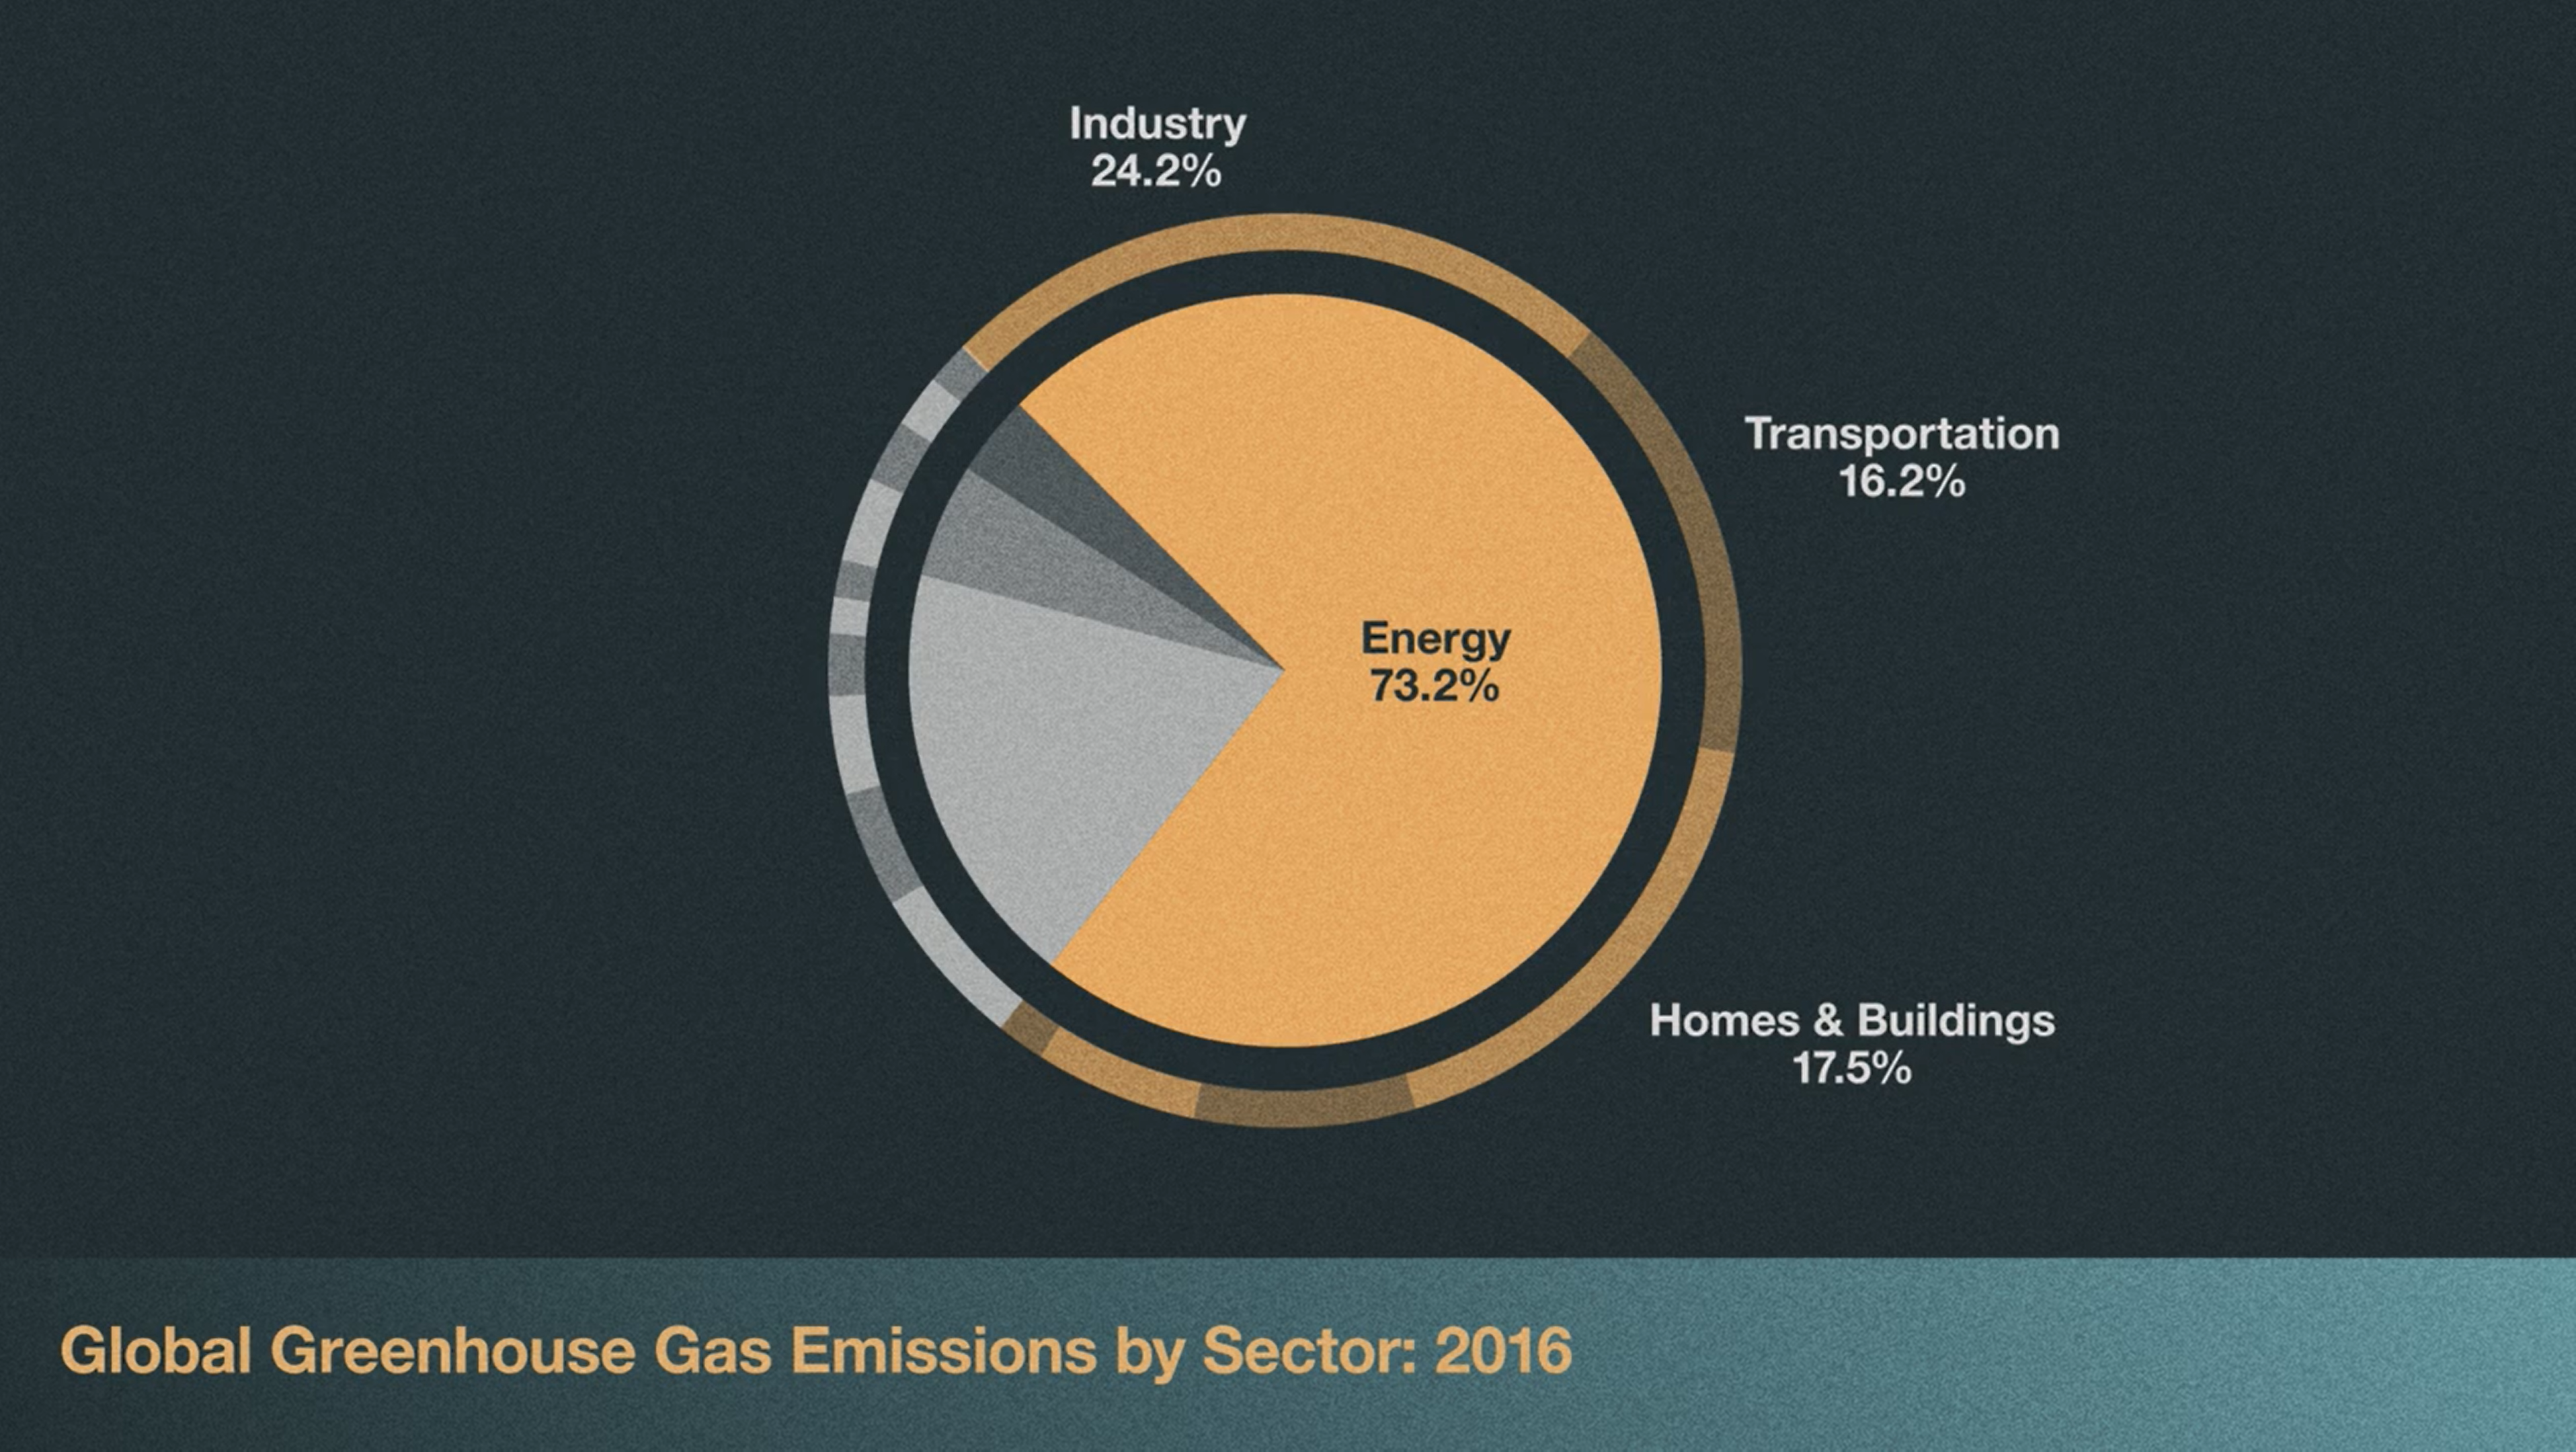
We can also rank total emissions by economic sector to understand which activities are driving the problem. Doing so makes clear that there will never be a single solution to decarbonizing the economy because the use of fossil fuels and sources of emissions within each sector are so diverse[7].

This chart from our world and data breaks down the sources of greenhouse gas emissions from 2016 across economic sectors[8]. You can see that about 73% of total emissions come from the energy sector. This is energy use in homes, buildings, transportation, and industry. 18% comes from agriculture, forestry and land use with the largest share within that bucket, coming from livestock and manure. Looking at the breakdown within these broad categories, we see that many different activities contribute to each sector’s total emissions. For example, emissions within the energy sector are split across industry, transport and buildings. Each of which will require very different approaches to decarbonize.
We know, for example, that focusing on electrification of road transportation should be a priority because road transport accounts for about 12% of total emissions. But to construct projections about the future. We have to understand what drives these economic activities in the first place and what factors influence how emissions heavy they actually are.
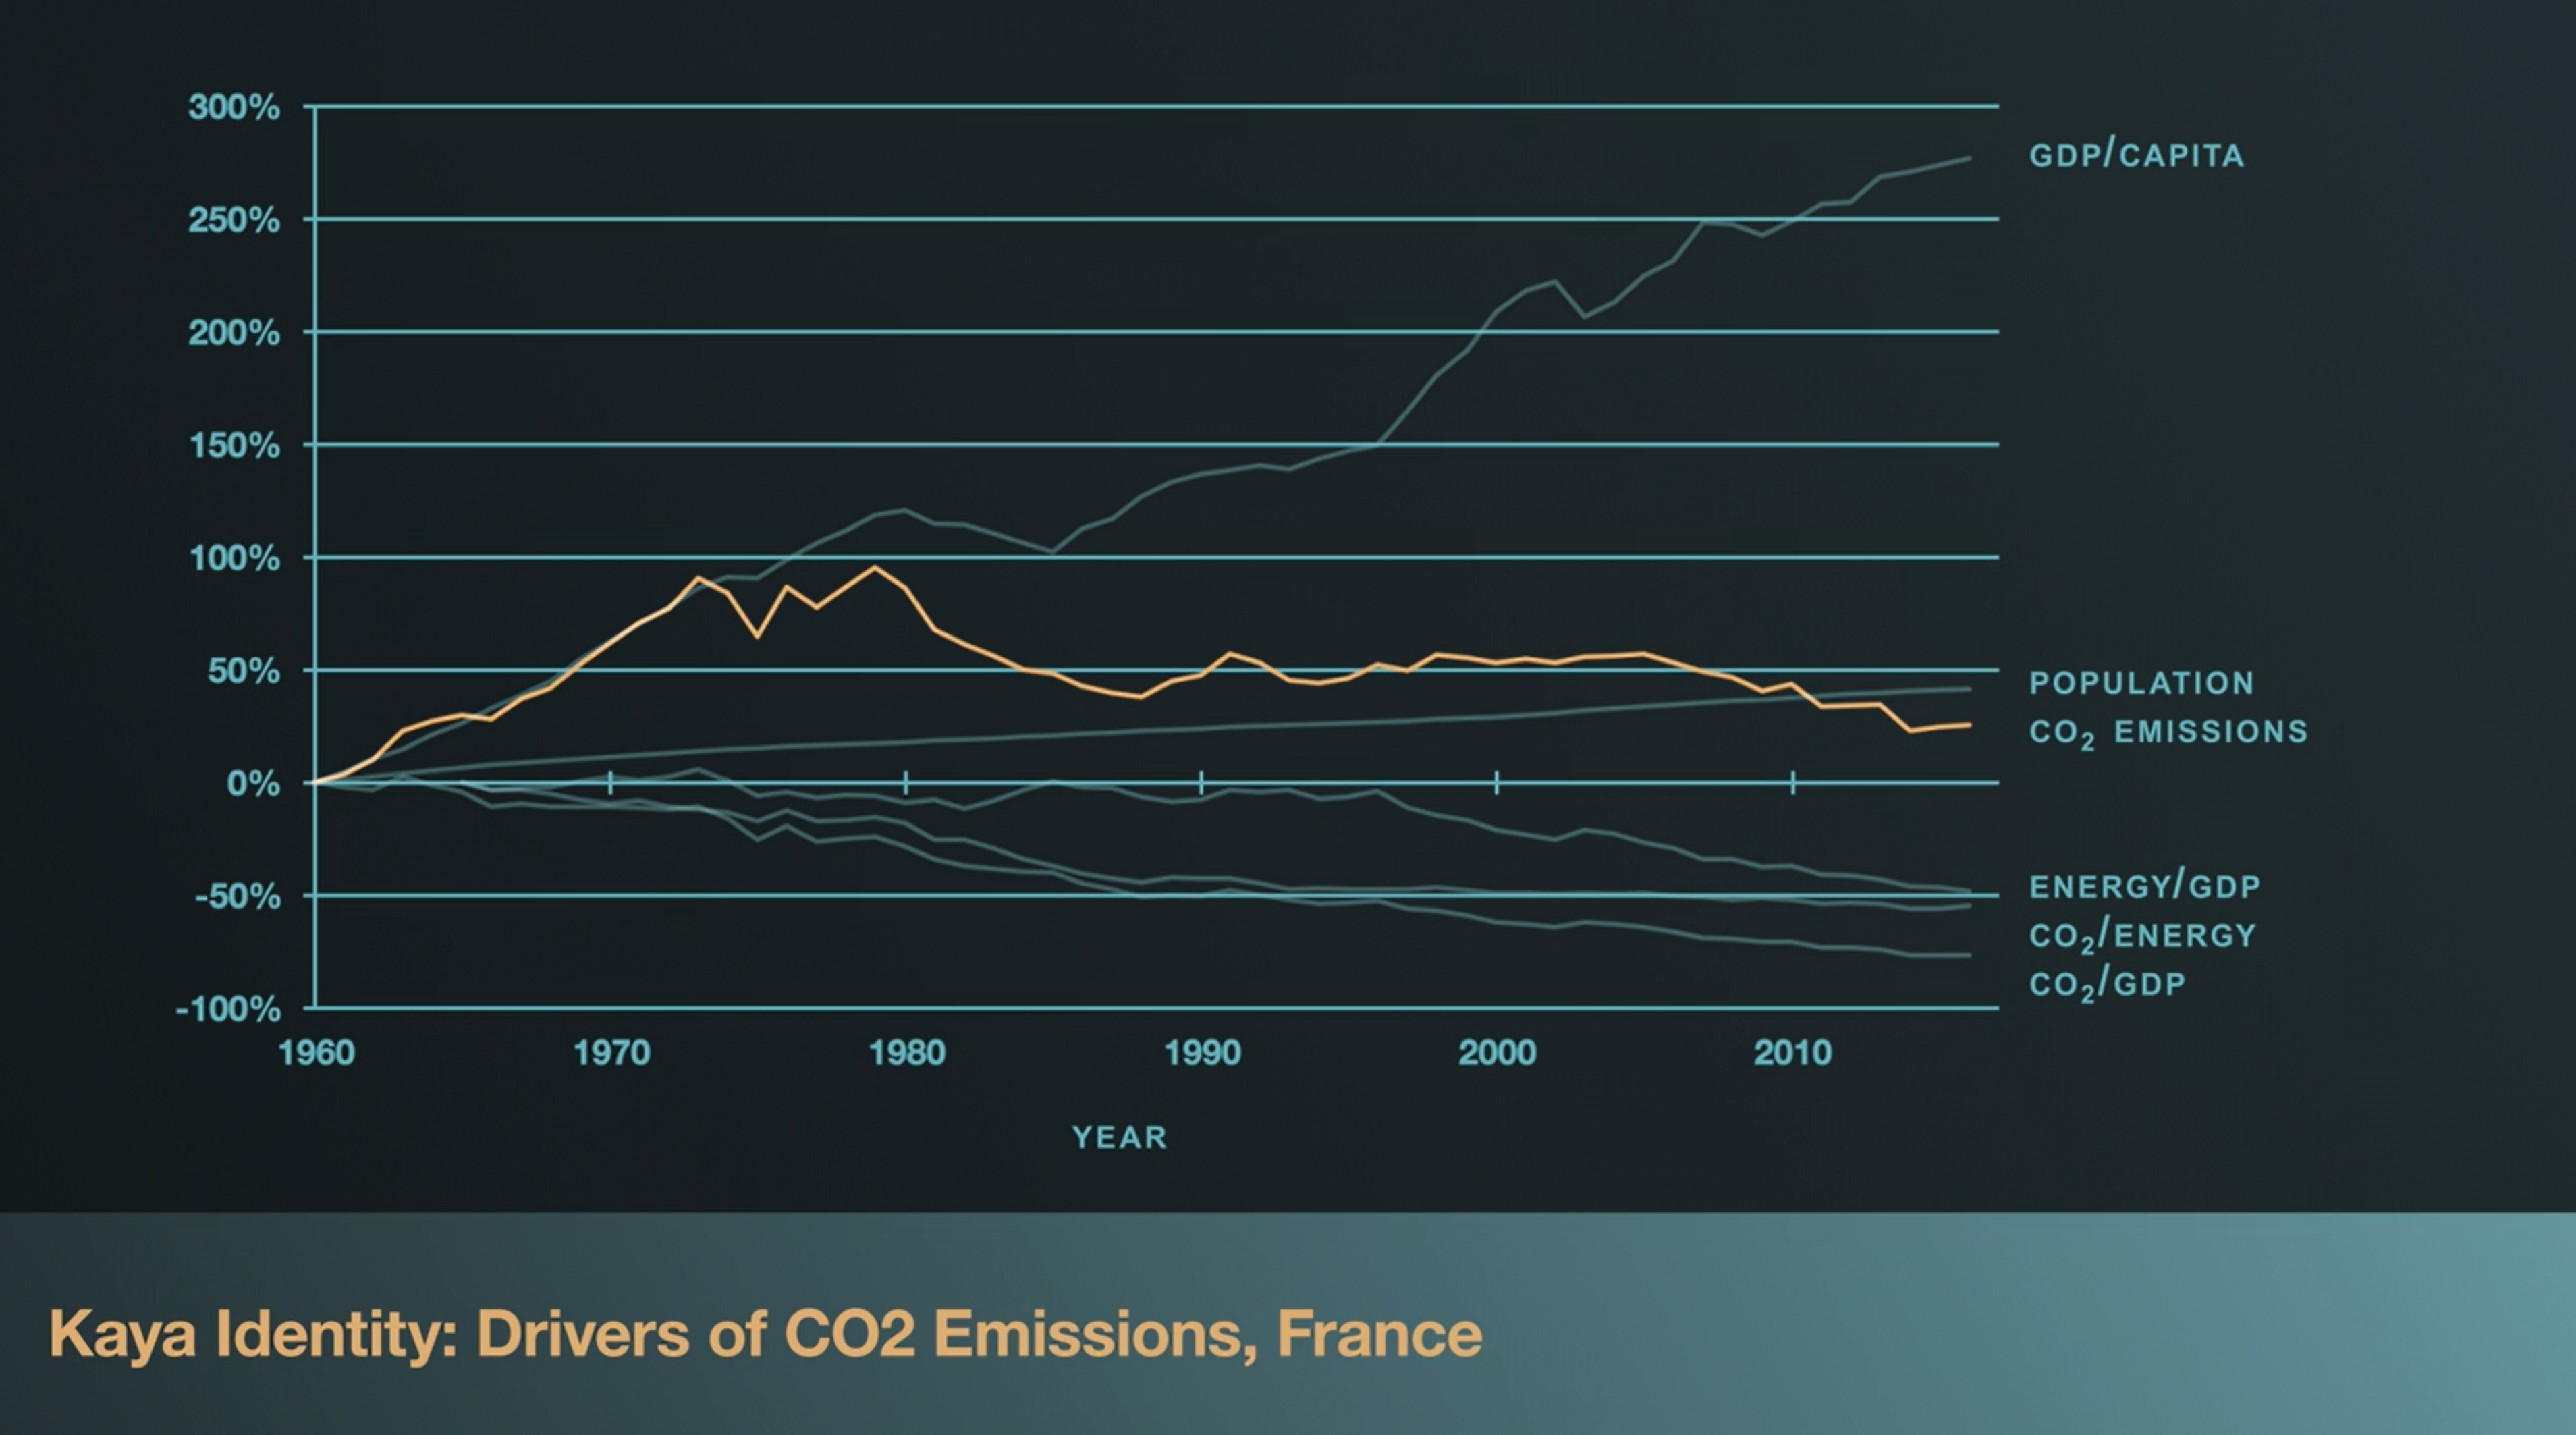
So, what underlying factors drive human emissions? We can look at some key indicators of human activity, GDP per capita, population, energy intensity of the economy, or how much energy is required to produce one unit of GDP, and carbon intensity, which is how much carbon is released to produce one unit of energy in that economy[9].
Looking at global trends, we see that most of our emissions since the 1970s have been driven by two of these factors, namely population growth and GDP per capita. The things that people need for basic survival, like food and shelter each have CO2 emissions associated with their production, processing, transport, and so on. The growth in population over time has contributed to the growth in CO2 emissions.
But people don’t just consume for basic survival. We also consume to maintain a particular lifestyle, whether that’s through air conditioning, fancy cars, 65 inch TV screens, or GV jets. As countries get richer and more developed their lifestyle-based consumption increases, and with it, CO2 emissions. For example, although China releases about twice the emissions of the United States, the average emissions of an American citizen is about twice that of an average Chinese citizen[10,11,12]. Now, global population and GDP per capita are both projected to increase through the end of the century. Does this commit us to a path of increasing CO2 emissions, just when drastic cuts are most needed.
Not necessarily. The other two indicators, energy intensity and carbon intensity, are the key. Energy intensity is the ratio of primary energy supply to GDP. That is how much energy is required to produce one unit of GDP. And it is a measure of energy efficiency within a given economy. On a global scale energy intensity has decreased over time as a result of technology, fiscal incentives and regulations that have encouraged or enabled improved energy efficiency. Carbon intensity is the final and critical factor. Carbon intensity is the amount of CO2 that is released to produce one unit of energy consumed. Reducing the carbon intensity in our energy systems, or in other words, our reliance on fossil fuels, is the most direct way to curb emissions. For example, France, which has the greatest reliance on nuclear energy compared to other EU countries has decoupled growth in GDP per capita from CO2 emissions because nuclear fuel does not produce greenhouse gas emissions[13,14]. It’s possible, but requires the right enabling factors.

In future episodes we’ll look at what policies countries can implement to accelerate the development of a low carbon energy system, and what technologies may be critical to aid in the transition to a zero carbon future. We’ll also look at what commitments countries have made to reduce their emissions and what, and how they are doing as they work toward those goals.
Sources
1. NOAA National Centers for Environmental information, Climate at a Glance: Global Time Series, published February 2021, retrieved March 11, 2021 from https://www.ncdc.noaa.gov/cag/global/time-series
2. IPCC, 2018: Summary for Policymakers. In: Global Warming of 1.5°C. An IPCC Special Report on the impacts of global warming of 1.5°C above pre-industrial levels and related global greenhouse gas emission pathways, in the context of strengthening the global response to the threat of climate change, sustainable development, and efforts to eradicate poverty [Masson-Delmotte, V., P. Zhai, H.-O. Pörtner, D. Roberts, J. Skea, P.R. Shukla, A. Pirani, W. Moufouma-Okia, C. Péan, R. Pidcock, S. Connors, J.B.R. Matthews, Y. Chen, X. Zhou, M.I. Gomis, E. Lonnoy, T. Maycock, M. Tignor, and T. Waterfield (eds.)]. In Press.
3. Hannah Ritchie and Max Roser (2020) Greenhouse gas emissions. Published online at OurWorldInData.org. Retrieved on March 23, 2021 from: ‘https://ourworldindata.org/greenhouse-gas-emissions#by-gas-how-much-does-each-contribute-to-total-greenhouse-gas-emissions’
4. United Nations Environment Programme (2020) Emissions Gap Report 2020. Nairobi. Retrieved from: ‘https://www.unep.org/emissions-gap-report-2020’
5. Carbon Dioxide in the Atmosphere visualization from NASA’s Scientific Visualization Studio (2016), data from Orbiting Carbon Observatory-2. Retrieved on March 24, 2021 from: ‘https://svs.gsfc.nasa.gov/4514’
6. Cumulative CO2 Emissions by World Region, compiled by Our World in Data from: Friedlingstein, Pierre et al. Global Carbon Project (2020) Supplemental data of Global Carbon Budget 2020 (Version 1.0) [Data set]. Global Carbon Project. https://doi.org/10.18160/gcp-2020, Retrieved March 25, 2021 from https://ourworldindata.org/grapher/cumulative-co2-emissions-region?stackMode=absolute
7. Climate Watch Historical GHG Emissions (2021) Washington, DC: World Resources Institute. Retrieved on March 23, 2021 from: https://www.climatewatchdata.org/ghg-emissions
8. Adapted from Hannah Ritchie (2020) “Sector by sector: where do global greenhouse gas emissions come from?” Published online at OurWorldInData.org. Retrieved on March 23, 2021 from: https://ourworldindata.org/ghg-emissions-by-sector
9. Yamaji, K et al. (1993) A study on economic measures for CO2 reduction in Japan. Energy Policy, 21(2), 123-132, ISSN 0301-4215, https://doi.org/10.1016/0301-4215(93)90134-2.
10. Data from the Global Carbon Project (2020). Supplemental data of Global Carbon Budget 2020 (Version 1.0) [Data set]. Global Carbon Project. https://doi.org/10.18160/gcp-2020. Retrieved on March 24, 2021 from: https://folk.universitetetioslo.no/roberan/GCB2020.shtml
11. Size of 1 tonne of CO2 assumes standard pressure of 1 bar and a temperature of 60℉ (CO2 density = 1.84 kg/m3) Retrieved on March 24, 2021 from: http://www.energy.psu.edu/tools/CO2-EOS/index.php
12. Thanks to the Carbon Visuals project for the idea. Check out all of their great visualizations at https://www.realworldvisuals.com/
13. IEA (2020), SDG7: Data and Projections, IEA, Paris. Retrieved on March 24, 2021 from: https://www.iea.org/reports/sdg7-data-and-projections
14. Maddison Project Database, version 2018. Bolt, Jutta, Robert Inklaar, Herman de Jong and Jan Luiten van Zanden (2018), “Rebasing ‘Maddison’: new income comparisons and the shape of long-run economic development”, Maddison Project Working paper 10.