Featured Experts

Simon Watson
Director of the Delft University of Technology Wind Energy Institute

Simon Watson
Director of the Delft University of Technology Wind Energy Institute
Simon Watson is a professor of wind energy and the Director of Delft University of Technology’s Wind Energy Institute.
Dr. Watson began his career in wind energy in 1990 and has worked at the Rutherford Appleton Laboratory, Good Energy, and as a senior lecturer the Loughborough University’s Center for Renewable Energy Systems Technology.
In this Episode
In order to reach global net-zero emissions by the middle of the century, modeled pathways project that wind energy will need to be a primary source of electricity, accounting for 19-43% of global electricity production.
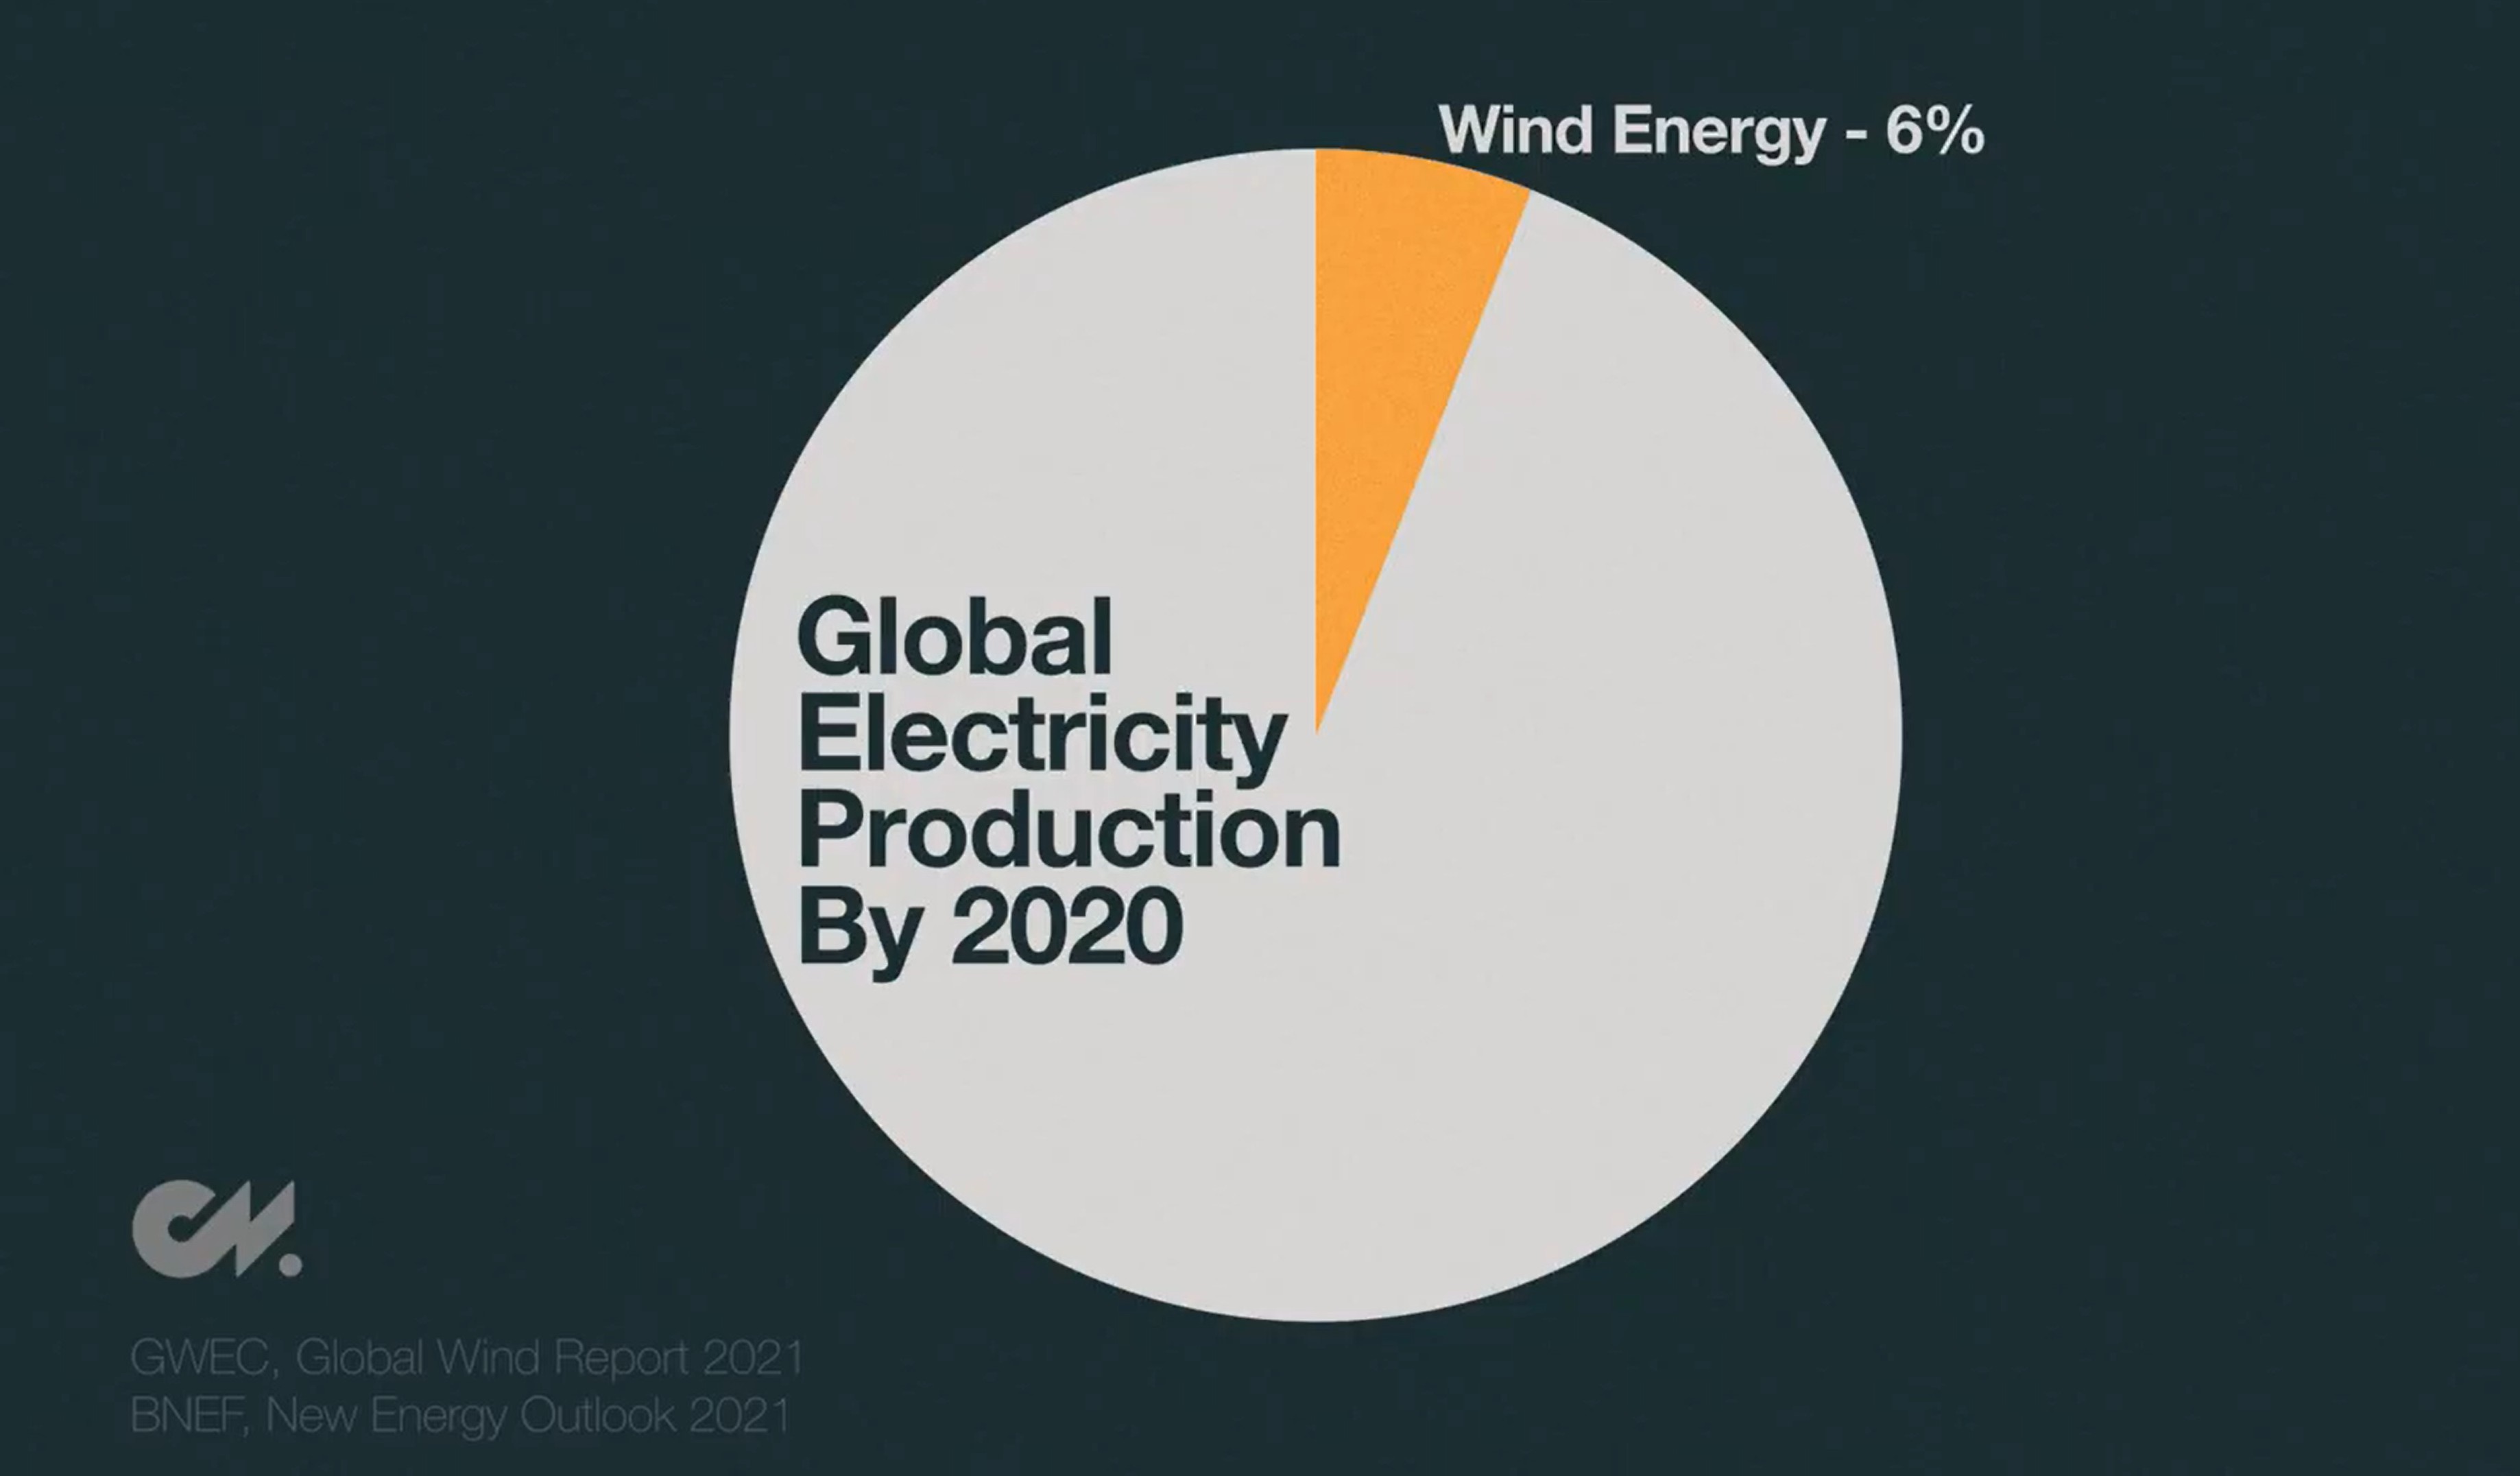
Today, though, wind produces only 6% of the world’s electricity.
So, what needs to happen to make this level of growth achievable? How can the design, location, and technology of wind turbines be optimized so that wind power reaches its full capacity and costs remain low?
Climate Now spoke with Dr. Simon Watson, Director of the Wind Energy Institute at TU Delft, to understand how we might scale wind power to the degree necessary to keep global warming below 1.5 degrees Celsius.
Related Media:


Climate Now: Dec 9, 2021
Scaling wind energy: What it will take to reach global net-zero, with Simon Watson
Wind energy is one of the cheapest sources of energy today, but it accounts for only ~6% of global electricity generation. To limit global warming to 2 degrees C or less, wind energy will need to scale up to about 5 times its current size. So, how can this b

Research Ep 1
Net-Zero by 2050
Pledges to achieve “net-zero” emissions are proliferating from companies and countries alike. However sincere these commitments may be, they rarely include specific plans to achieve that ambition. The Net-Zero America Report from Princeton Universi
Episode Transcript
Wind.
It has been used to power our sails for thousands of years, to grind our wheat and to pump our water for a millennium. And, we have used it to produce electricity for more than a century [1]. It might even become our biggest source of energy in the coming years [2,3].
Today, wind power accounts for only about 6% of global electricity use [4]. But, that number is going to increase. Modeled pathways to reach net-zero emissions project that wind will account for between 19 to 43% of global electricity by 2050 [5]. Pathways less reliant on wind will require significant increases in the use of nuclear energy or carbon capture instead [6].
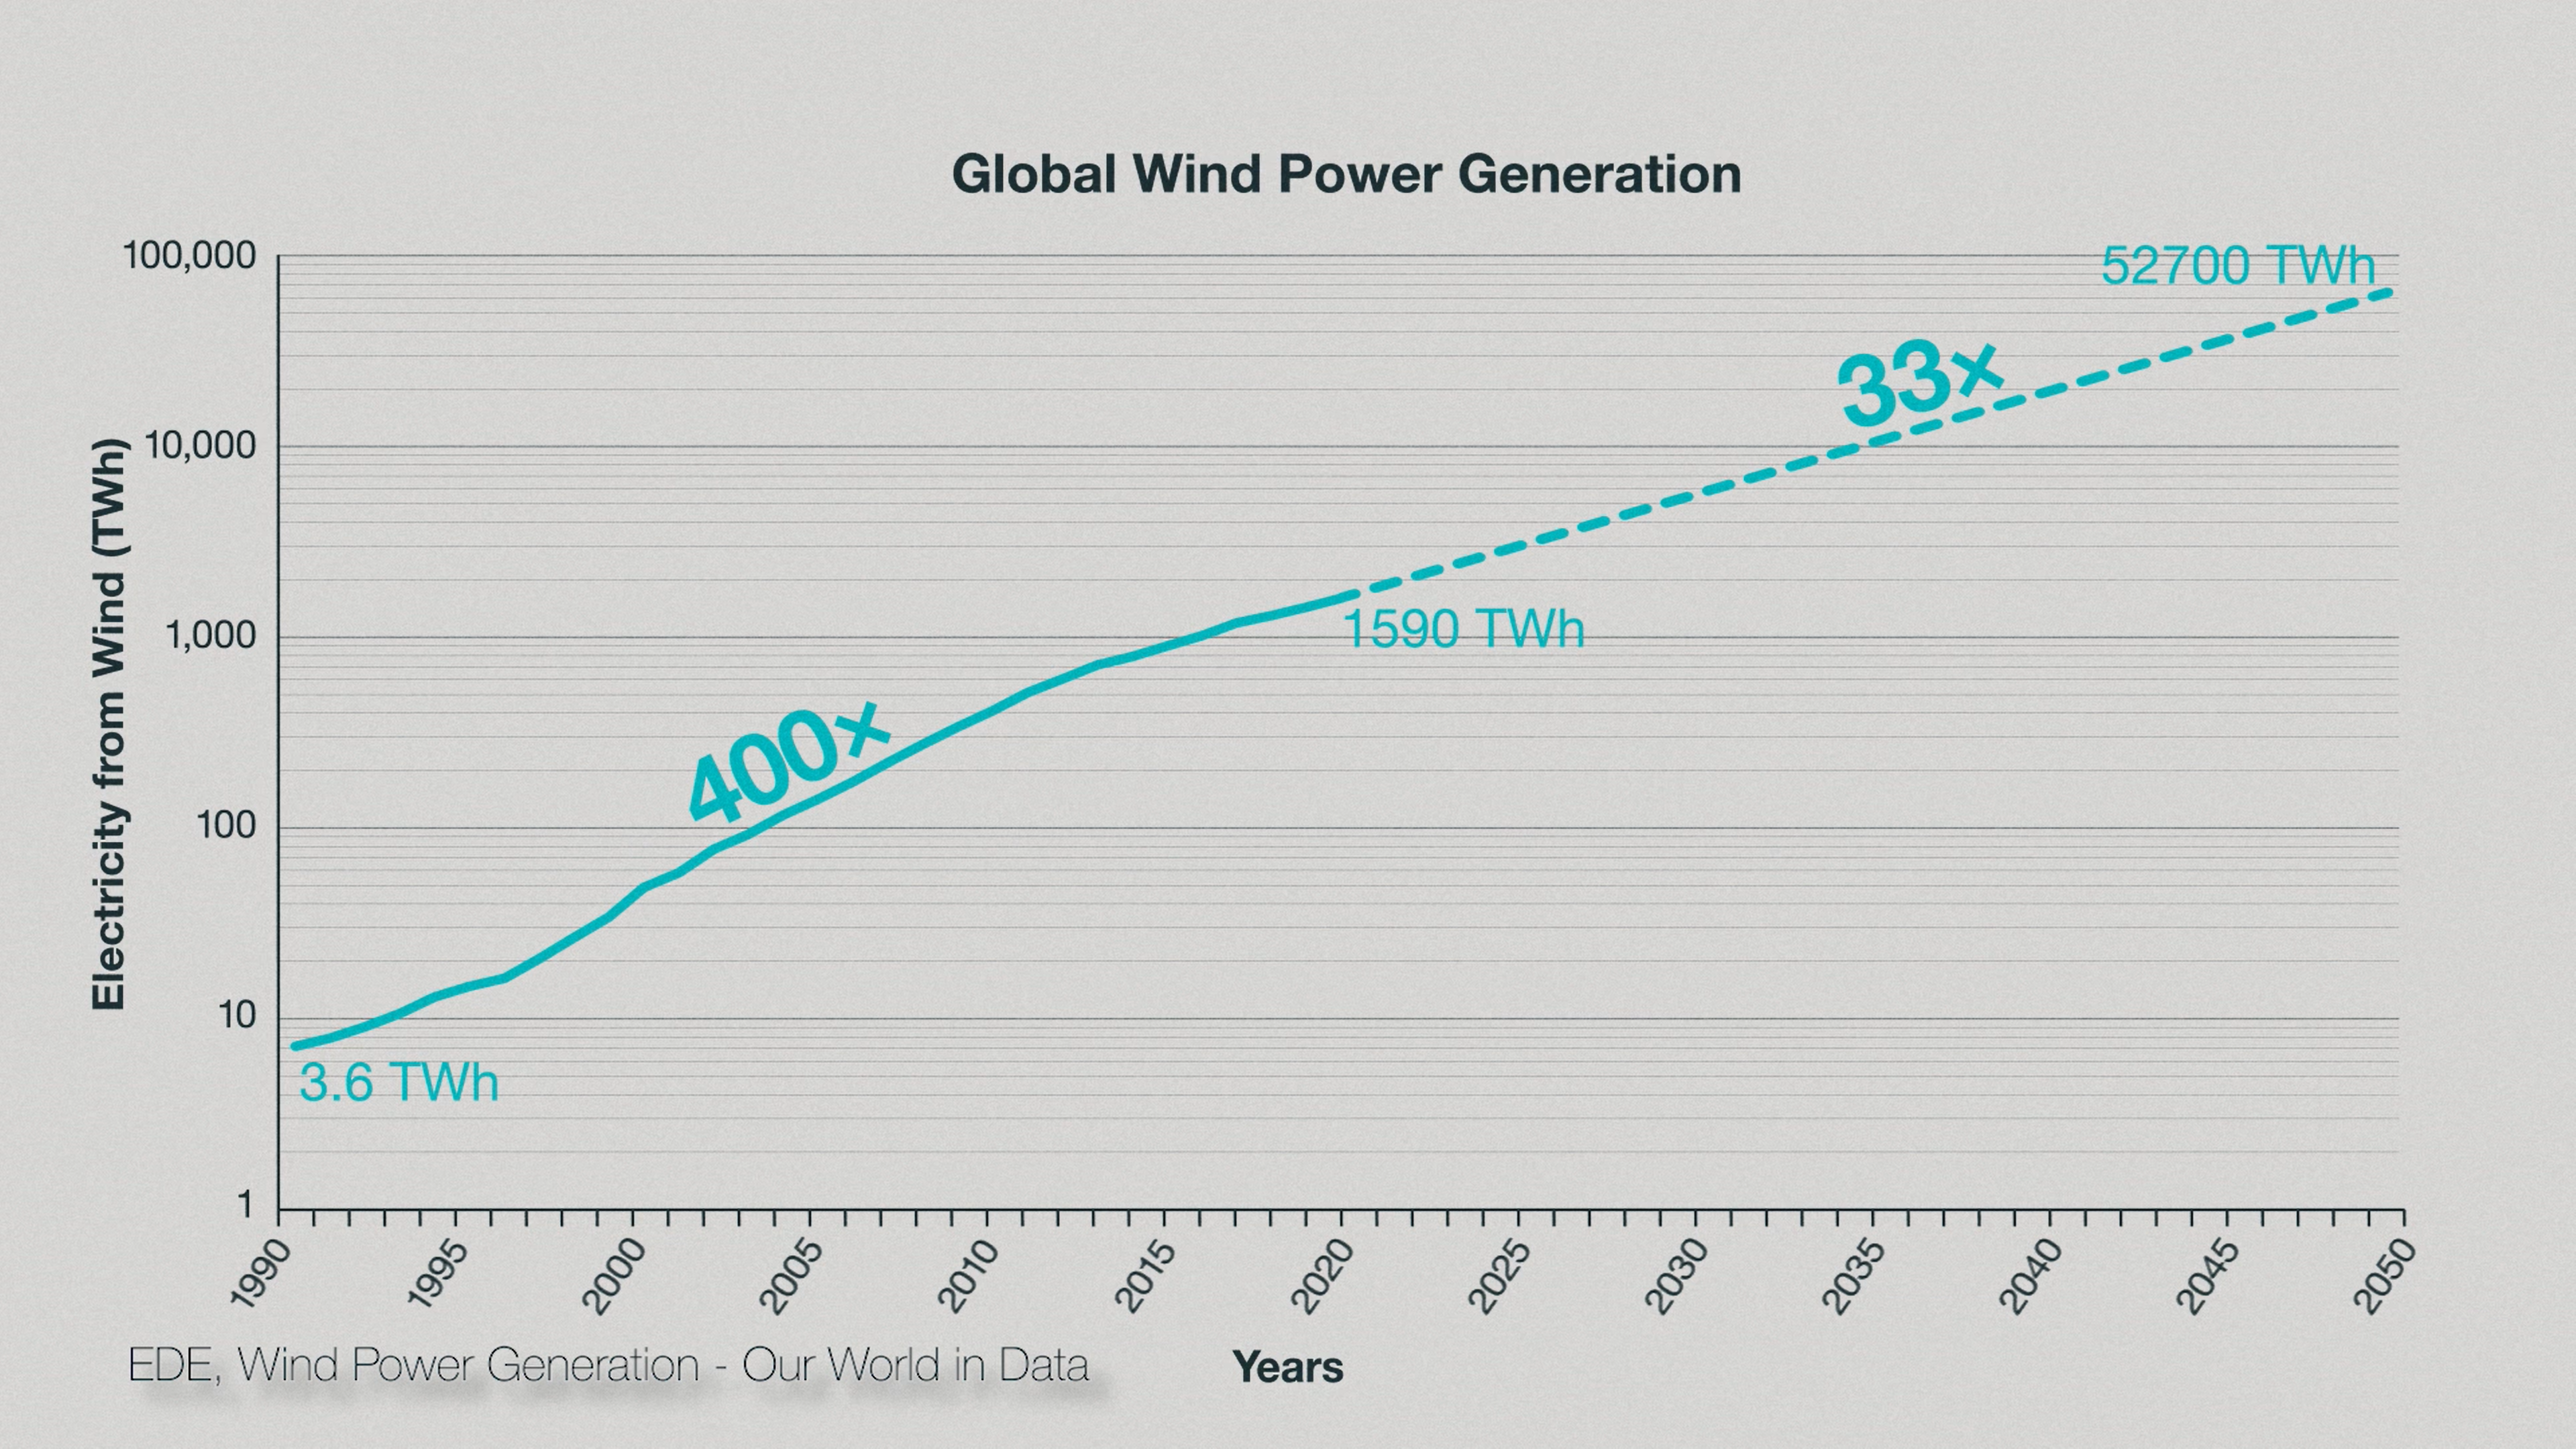
If 43% of the global electricity supply comes from wind by 2050, that will require a 33-fold increase in wind electricity production over the next 30 years [6]!
So how do we achieve that? Is it even possible? Well, it turns out that the amount of wind electricity produced in 2020 was 400 TIMES more than that generated in 1990 [7]. So 33 times increase over the next 30 years seems pretty achievable.
In this video we are going to look at why we were able to scale wind 400x in the last 30 years, to get a sense of what is possible in the next 30 years, to reach net-zero emissions by 2050.
Let’s start with a brief history of wind.
The first electric wind turbines were installed over 130 years ago. The earliest turbines were invented by James Blyth of Scotland [9], Charles Brush of the United States, and Poul la Cour of Denmark [10, 14]. The turbines were between 10 [9] and 18 [11] meters tall, and incredibly inefficient. Brush’s turbine could produce about 12 kilowatts [11], enough to power his personal research laboratory [1]. La Cour’s wind turbines looked more like old Dutch windmills than a modern wind turbine. They could produce 20 to 35 kilowatts [11], enough to power about 20 modern U.S. homes [12].
In the early 20th century, wind was only economically viable in regions without access to centralized electrical grids. La Cour’s wind turbines were built to supply power to rural settlements in Denmark [13]. And in the US, remote homes had to rely on their own wind turbine. But electrical grids steadily expanded, until most remote areas had access to cheap electricity from fossil fuels. By the middle of the century, local power generation from wind was nearly obsolete [1].
But, the 1970s marked the beginning of a shift. Two global oil crises hit – first in 1973, and then in 1979 [15]. Suddenly, countries that were highly dependent on fossil fuels identified the value of being able to produce electricity from the wind [13].
And what happened?
The US developed a Federal Wind Energy Program. Germany began subsidizing wind energy development, and Denmark partnered with NASA to build a new wind energy test program [13]. Wind energy research started popping up around the world.
In the early 1980s, the oil crises had ended and wind energy was still very expensive [16]. But the research programs remained. And with funding to expand and improve the technology, the cost of wind energy dropped – quickly and significantly [17]. Private companies partnered with the research programs and began developing large-scale windfarms [13]. Three of those companies remain among the largest wind turbine manufacturers today: from Denmark there was Vestas and Danregn Vindkraft. The latter would go on to become German-Spanish owned Siemens-Gamesa. In the US, it was General Electric Wind [10].
The keys to driving down the cost of wind fell into two categories:
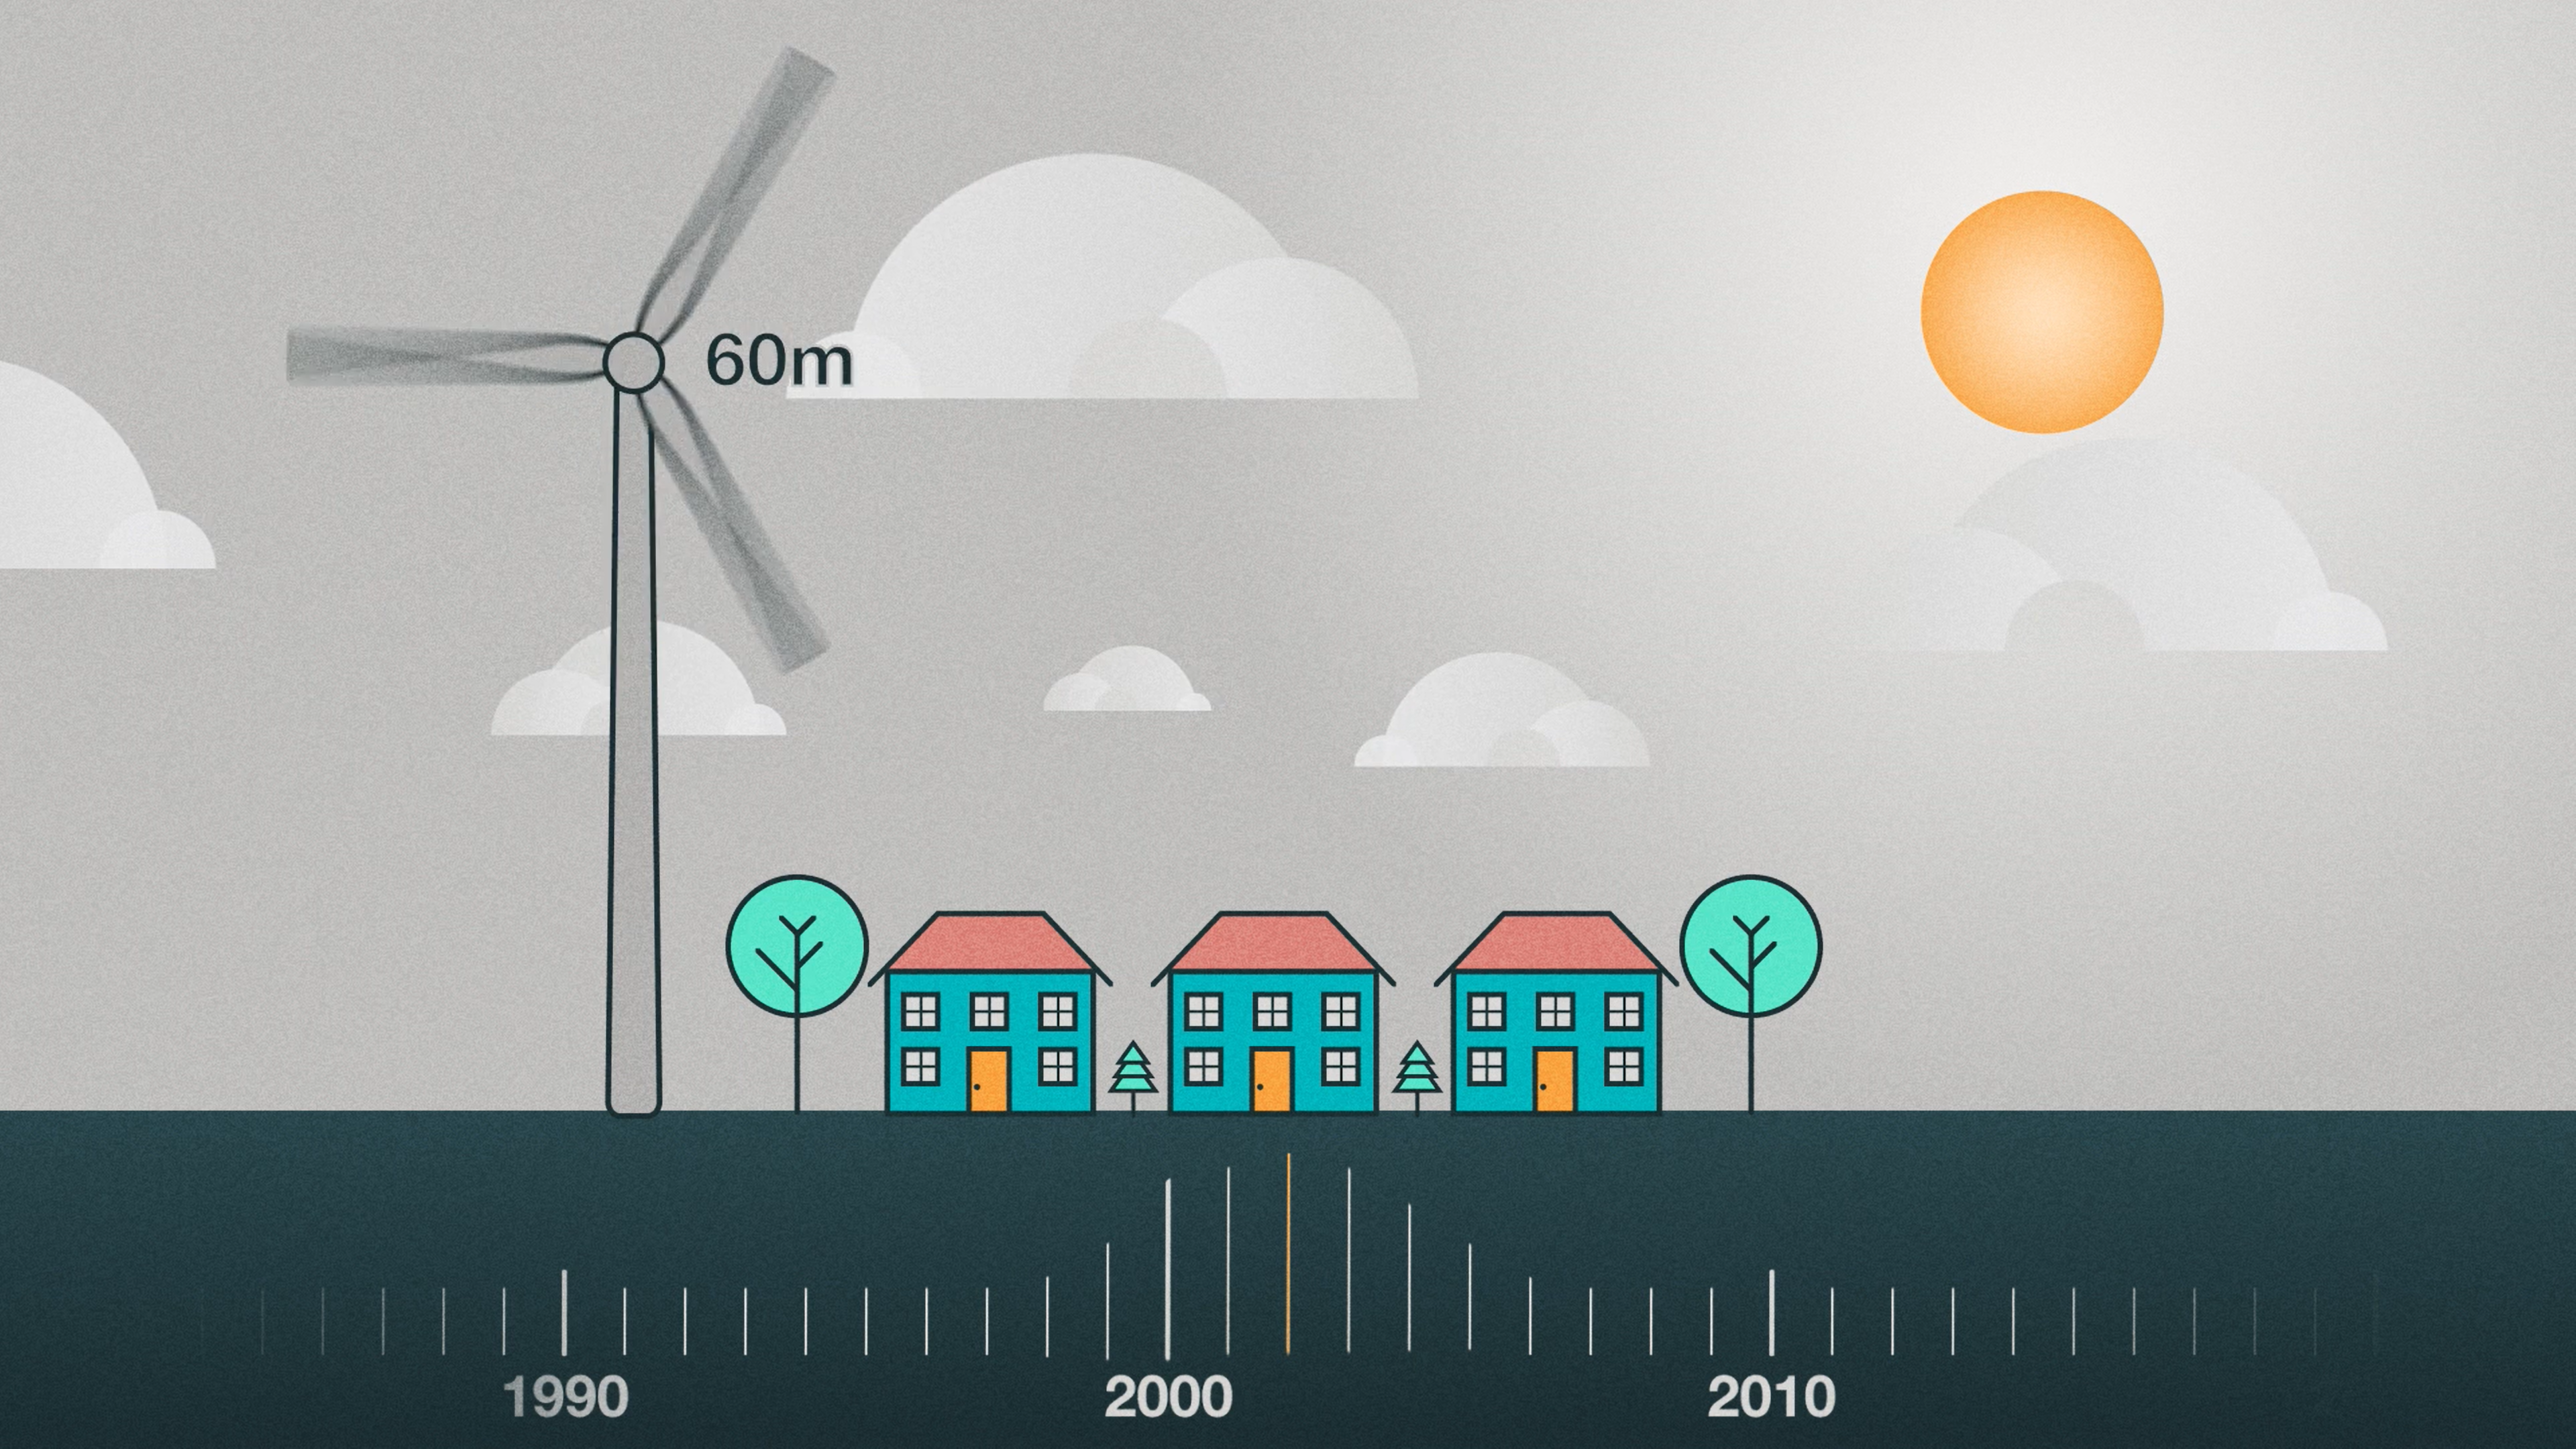
First, windmills needed to go where the wind blows the most: the higher up in the sky, the better [20]. By the end of the 1990’s wind turbines were up to 60 meters tall [21,22].
Second, engineers found that with longer blades, wind turbines could capture MORE of the wind’s available energy [22]. By the beginning of the 21st century, tall turbines with long blades were producing one thousand times the electricity of la Cour and Brush’s first windmills [22]. This meant that although the turbines themselves were more expensive to install, the LEVELIZED COST OF ENERGY was significantly lower. Levelized cost of energy, or LCOE, is a way to compare the costs of different types of energy. It includes the combined costs of installation, operation and maintenance, and for fossil fuels and nuclear – the fuel [23]. Think of it as the average price an electricity user would have to pay in order for a power plant to break even over its lifetime.
By about 2010, the levelized cost of energy generated from wind had dropped below that from coal [24]. Wind power finally had a market, and global installation rates have been increasing steadily every year. And as we build, we learn and get better. Costs have continued to decrease, dropping 56% since 2010 [25].
And as of 2020, onshore wind was among the lowest cost energy resources, globally [24]. It is comparable to solar, and cheaper than gas or coal [26].
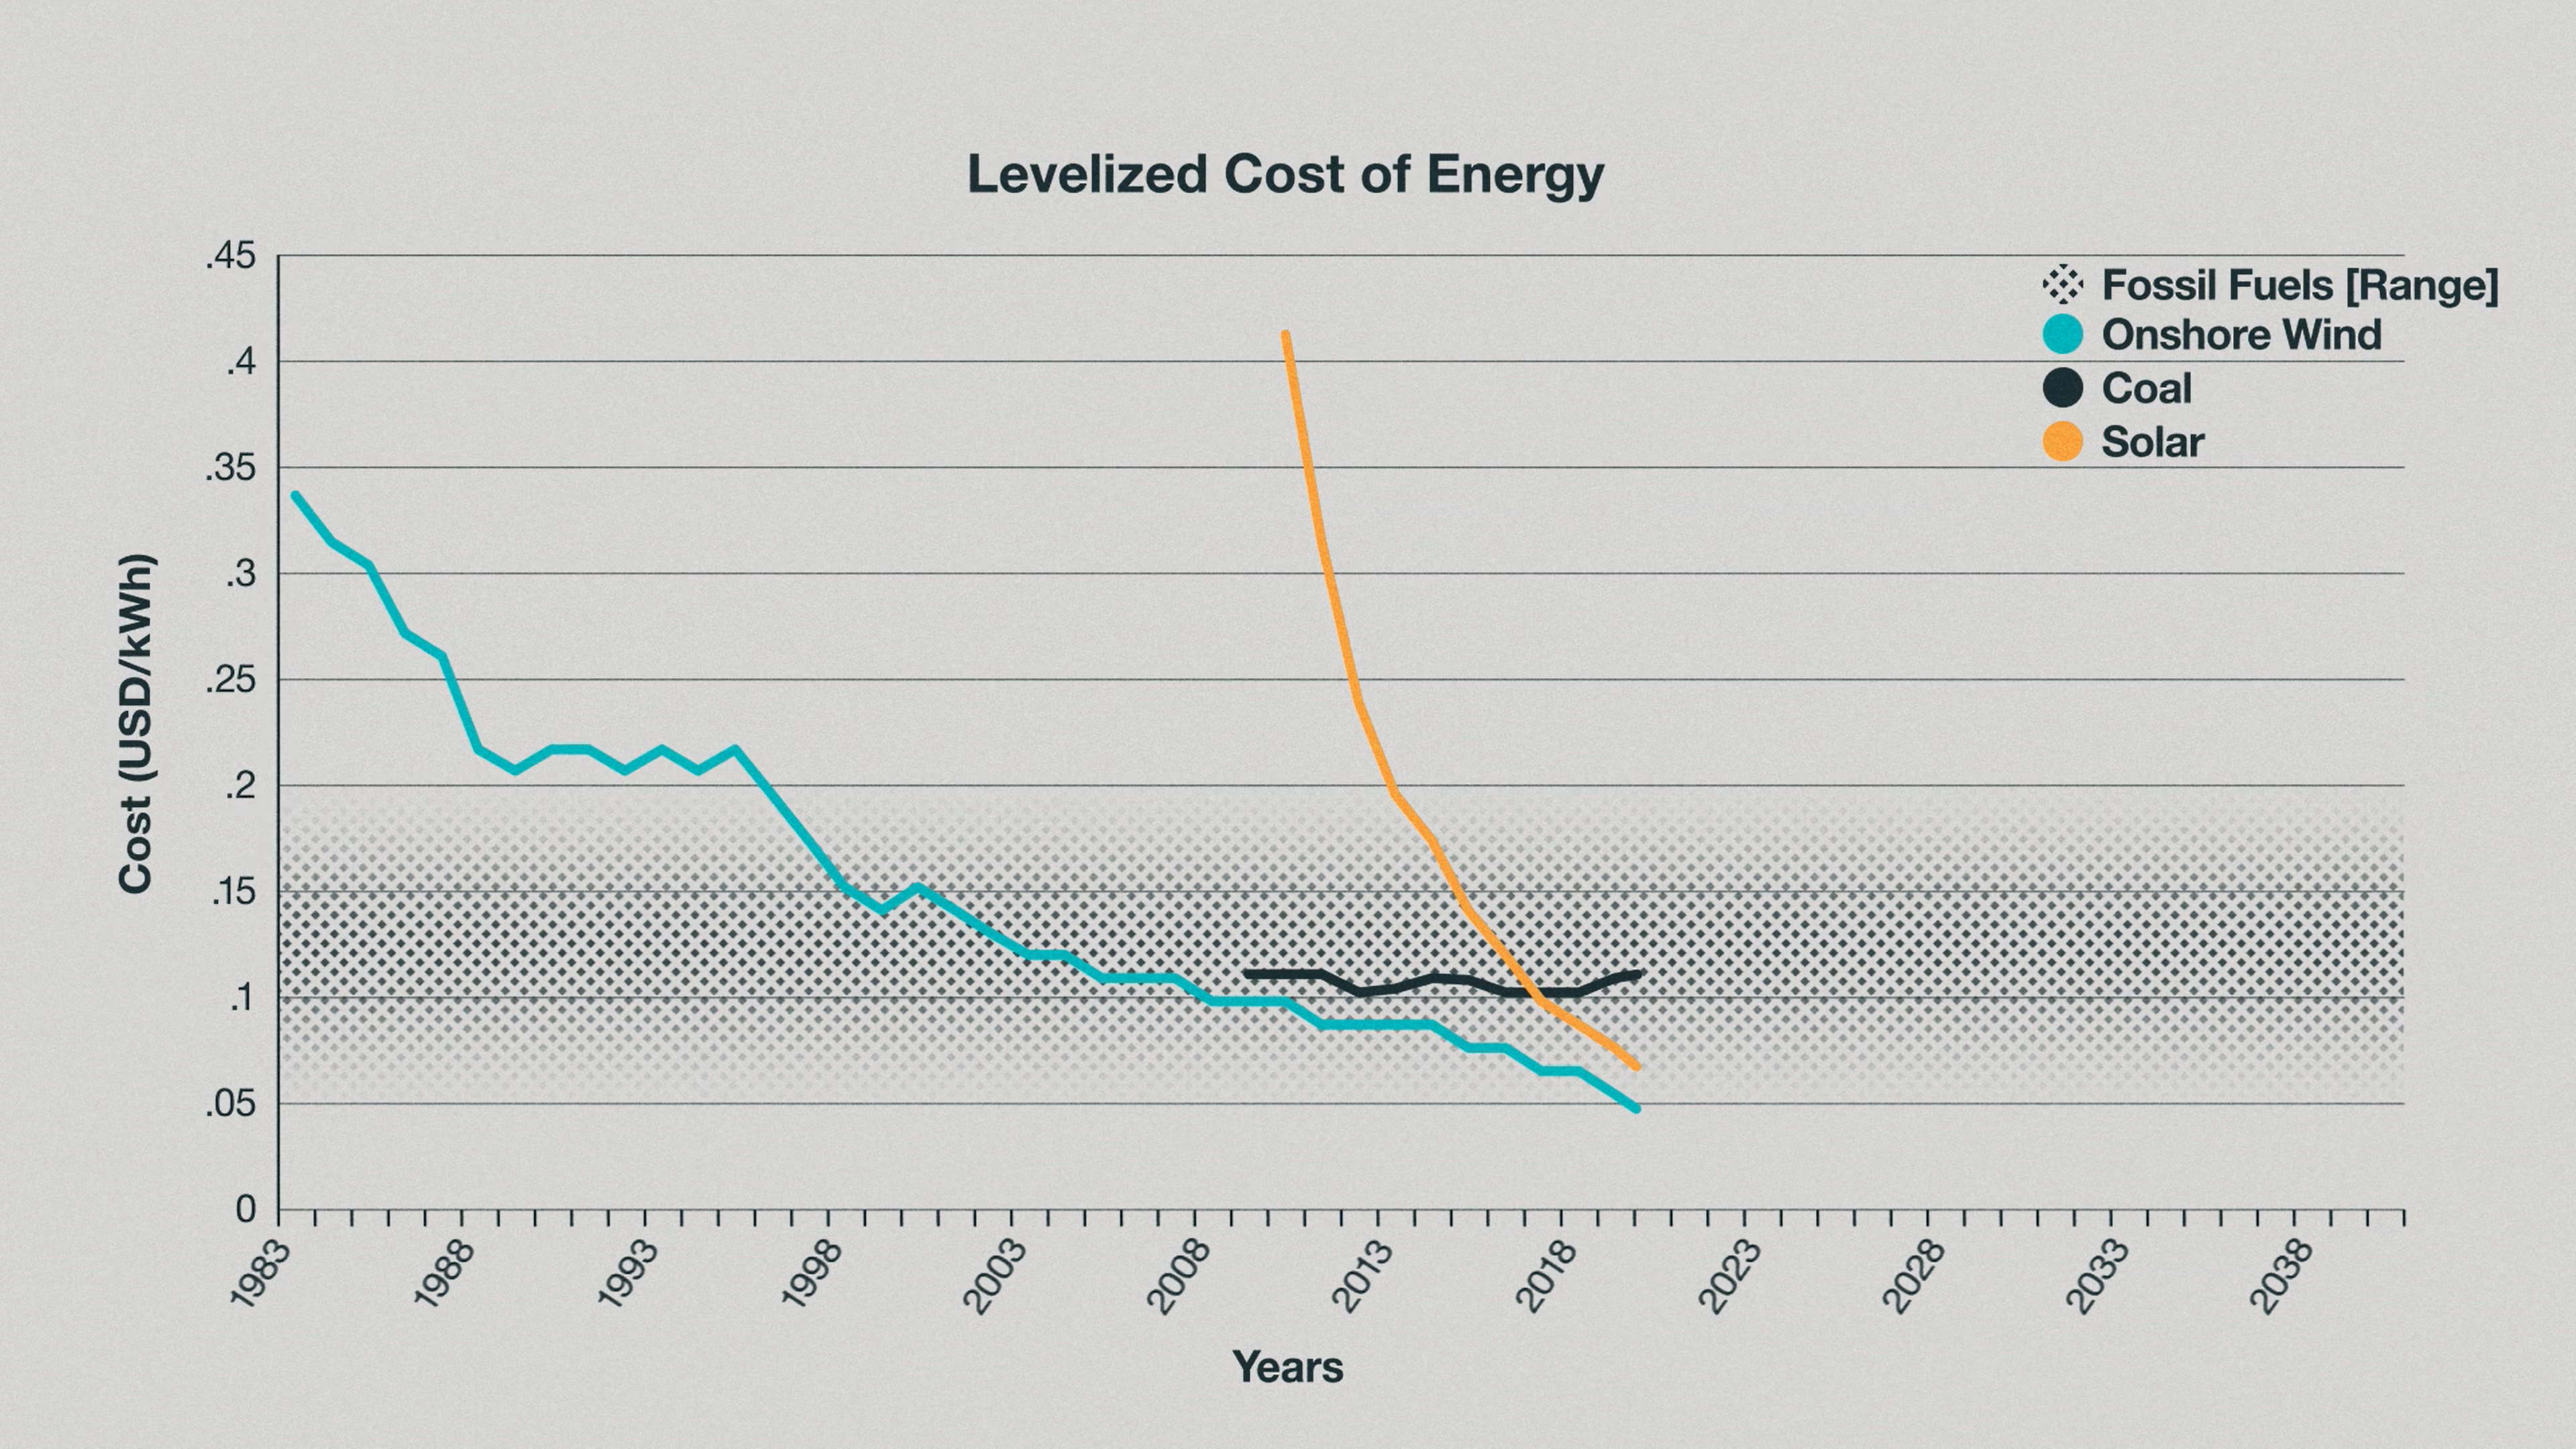
The question is, can wind energy grow to meet 43% of our electricity demands while still remaining so economical?
The cost decrease of the 2000’s was largely a continuation of increasing efficiency by building taller turbines with longer blade lengths [22]. But there are practical limitations to the length of a blade or diameter of a tower that can be transported. And that limits how big turbines can get [22].
Luckily, there is no shortage of places to innovate. Costs can continue to drop by putting wind turbines where the wind blows the strongest and most consistently. The further offshore you go, and higher in the air you go, the harder and more consistently the wind blows [22,27]. So new technologies are exploring how to exploit these regions [28].
Offshore wind, where turbines are anchored to the shallow seabed just off the coast, is already an established market. Installations began in the early 2000s [5], and were initially a significantly more expensive alternative to onshore wind [25].
Dr. Simon Watson, Professor of Wind Energy Systems and Director of the Wind Energy Institute at the Technical University of Delft, explains why.
Dr. Simon Watson:
In the early days, when we were building offshore wind farms, people were inexperienced. They weren’t quite sure the best way to do things. The best way to maintain the wind farms once they were built. Mistakes were made, you know, in the designs as well, because a lot of the early offshore wind turbines were simply onshore designs that were made, you know, effectively marine proof. And that wasn’t really good enough for the conditions that we’re seeing offshore with the wind and waves and so on. So I think people have learned very rapidly what’s the best way to build the turbines, to install them.
Like onshore wind, prices dropped as capacity increased, and efficiencies were found through learning by doing. Through growth in turbine size, movement from shallow to deeper waters, and optimization of operation and maintenance strategies [28], the levelized cost of energy for offshore wind has decreased 42% globally since 2010 [25].
By 2020, it made up 4.7% of global installed wind capacity [5]. And, given that larger and more efficient turbines can be installed offshore, and that wind blows more consistently over the ocean, offshore wind is projected to become cheaper than onshore by 2035 [29].
New technologies are launching in even more consistently windy places, such as FAR offshore. Existing offshore technology can be installed in water depths of about 40 meters, and as far as 80 kilometers from the shore [28]. In floating windfarms, wind turbines are built on platforms instead of anchored to the seabed so that they can operate in much deeper waters [28]. As of 2021, there is one commercial floating wind farm, the 30 megawatt Hywind Scotland project in the North Sea [5].
Dr. Simon Watson:
The advantage of course with floating wind is you can actually put you in farm further out from the coast to benefit from higher wind speeds. And if you have a wind farm operating in higher wind speeds it potentially operates for larger amounts of its time, at its full capacity.
Another promising innovation expected to become commercially important by about 2030 is airborne wind [28]. Flying turbine devices, like kites, could operate at heights over 300 meters. They would have a significant levelized cost benefit because they require significantly less material to produce, and at such consistently windy altitudes, they have higher energy production than conventional turbines [28, 33].
Finally, with ever-increasing computational power, engineers can optimize the efficiency of existing wind farms. Interconnected wind farm systems can use data collected by sensors in the wind farms to turn turbines on and off in response to atmospheric changes and as a way to control airflow through the wind farm [34,35]. This can also reduce the cost of maintenance, by better predicting when that maintenance would need to occur [35].
So let’s come back to our question: can we scale up wind energy enough to provide 43% of the global electrical output in the next 30 years?
Doing that would require that each year, we install enough turbines to provide over 800 GW of new wind energy capacity [6]. And we would need to do that every year until 2050. For comparison, the new wind capacity installed in 2020 – which was a record year – was 93 GW [5]. So, we really need to ramp up installation if we want to reach that high end, 43%.
A lower-end estimate, in which wind makes up about 30% of global electricity production, would require about 250GW of new installations annually [25]. While that is still nearly triple what was installed in 2020, it is more feasible. We would simply need to continue increasing our rate of installations at the same pace as we have, since 2015. That seems doable.
But even reaching this more modest number will require ramping up investment in wind energy – BY A LOT. And not only in new wind installations, but ALSO in the industries that will support wind power generation [25]. This includes expanding electrical grid networks and capacity to ensure they can handle peak power times, and can accommodate lulls in wind in one part of the grid by using energy sourced from another [28].
It includes developing robust supply chains to support a rapid increase in manufacturing wind turbines [28].
There will also need to be investment in long-term energy storage options [36], an increase in maintenance ships for offshore wind [37], and research and development funds to support continued innovation in new wind technologies, such as those that are further offshore [25].
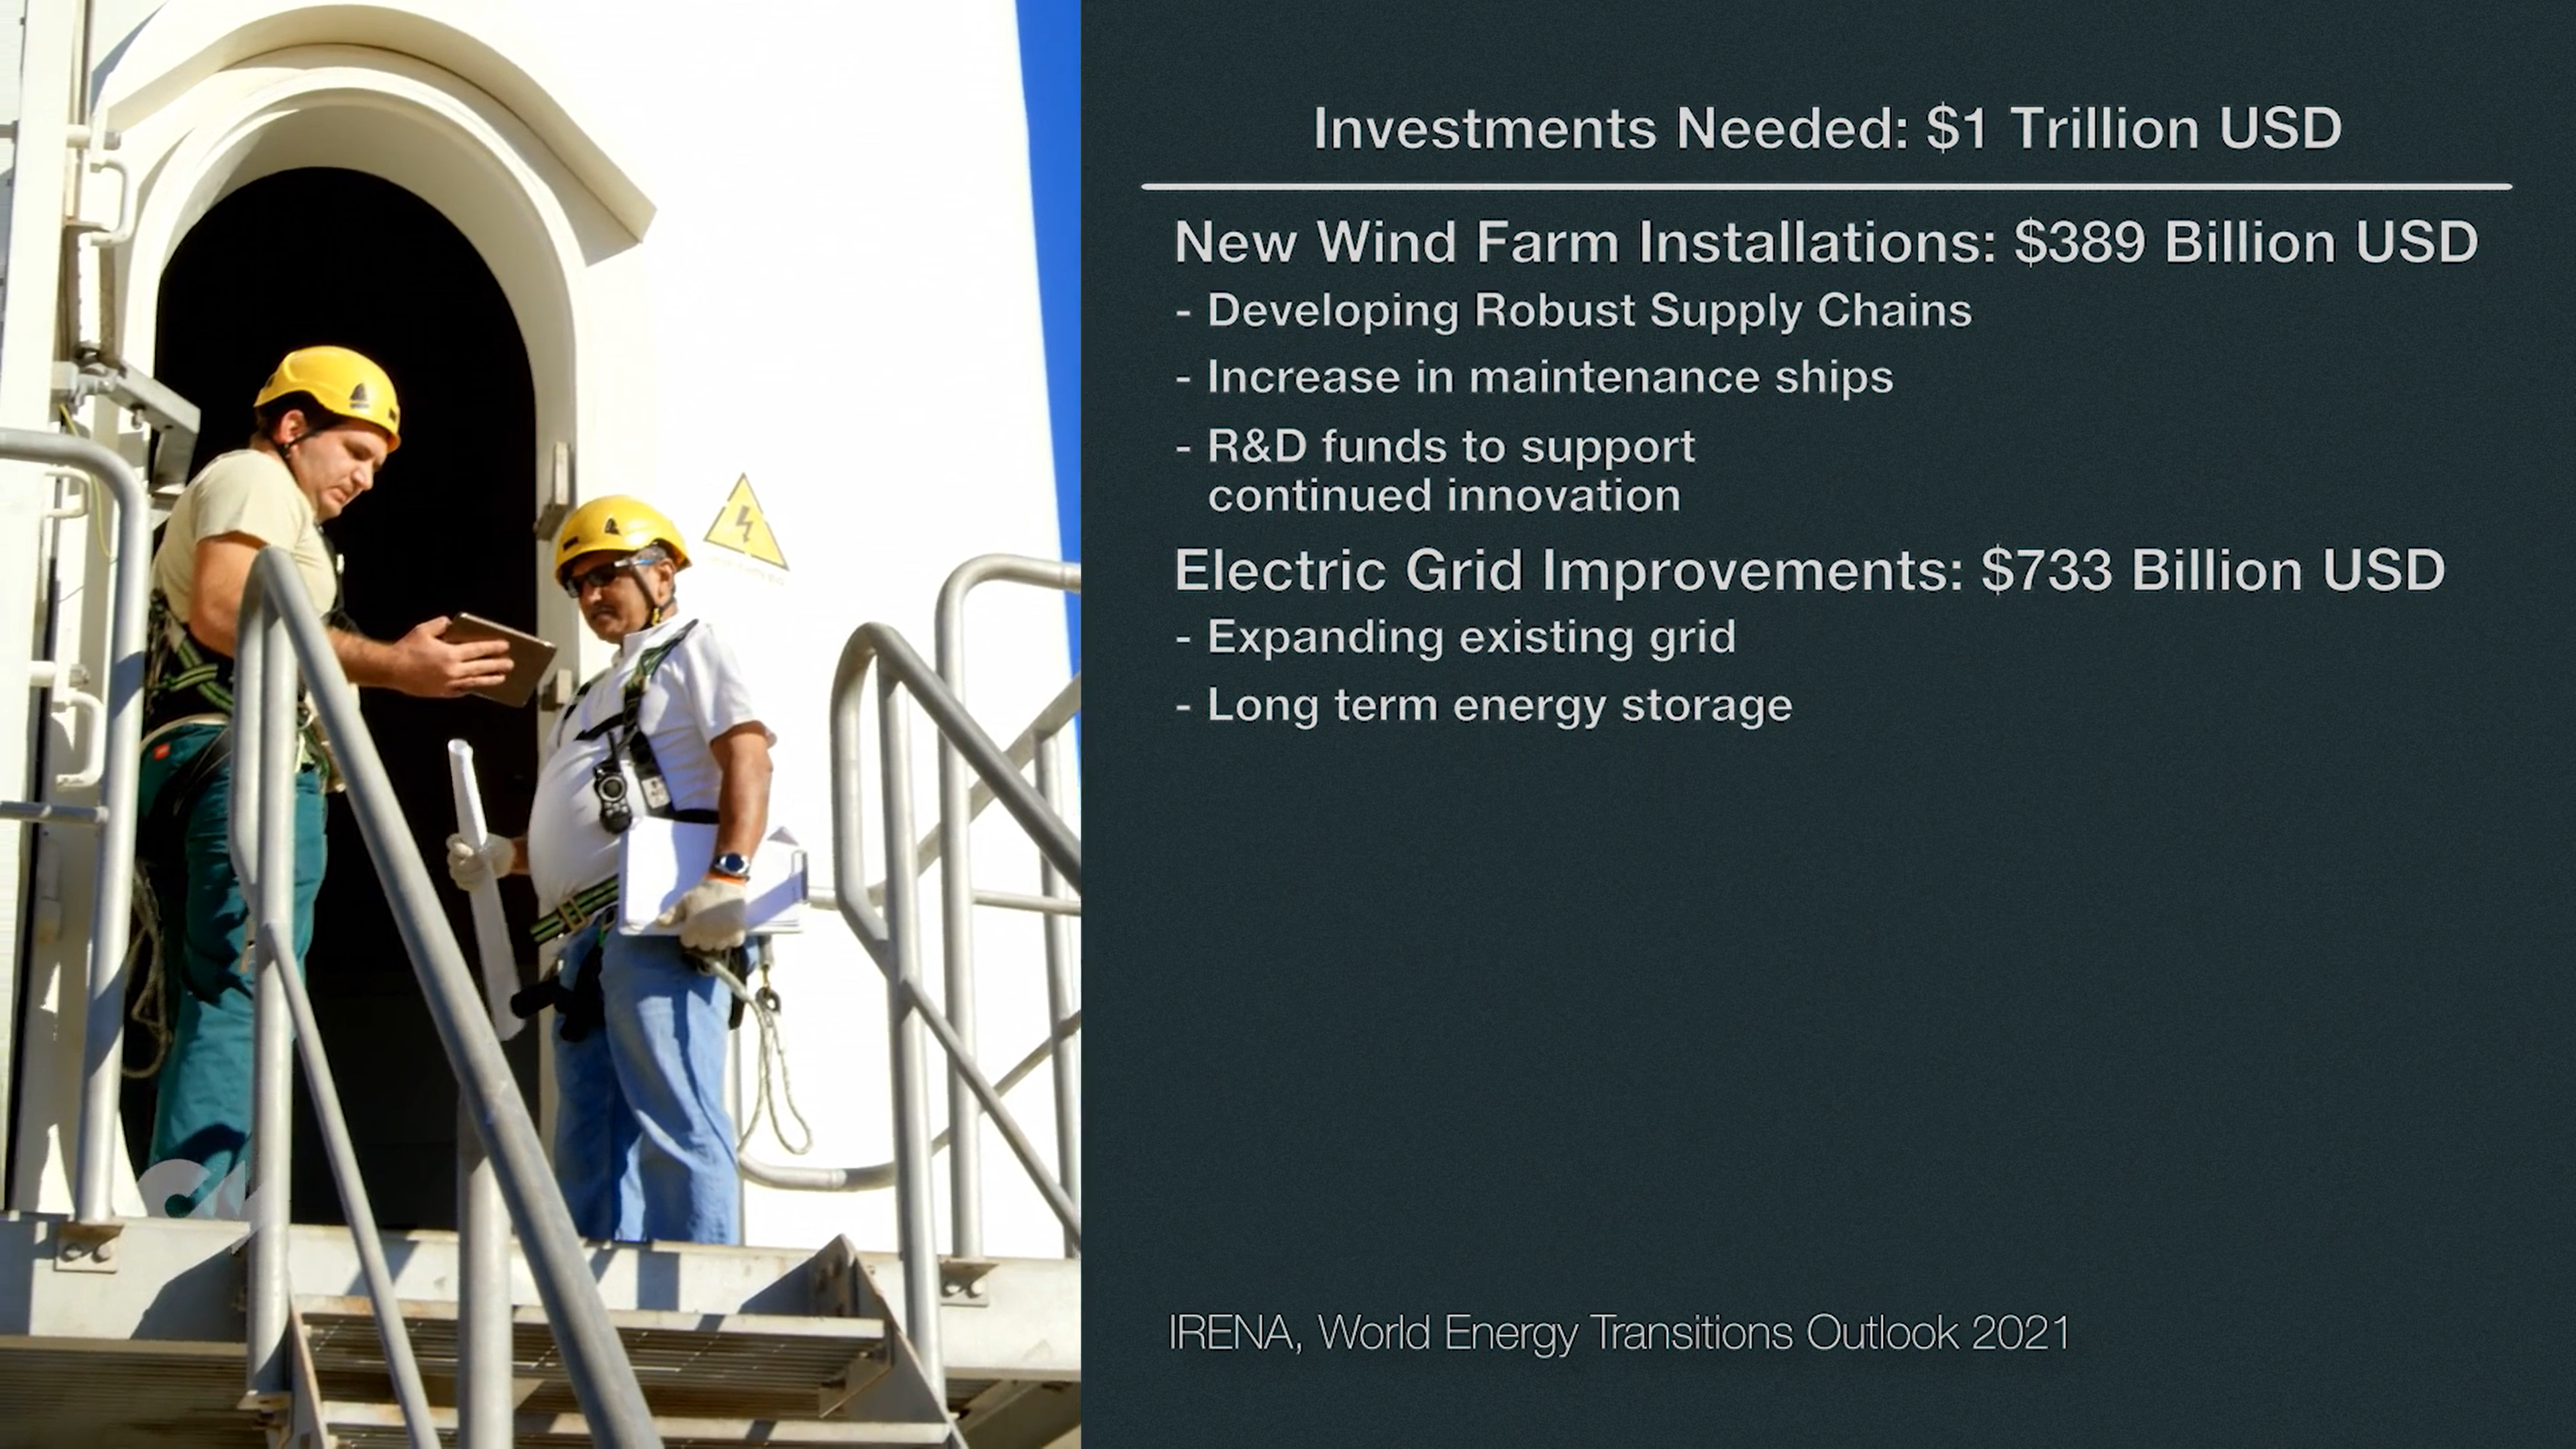
Conservative estimates for the cost of increasing our installed wind capacity to meet the electricity demand in a net-zero 2050 is more than 1 trillion US dollars annually, with 389 billion per year for new wind installation, and 733 billion per year for improving the power grid and storage capabilities [25].
While that sounds like a lot, it represents just over 1% of global GDP in 2019 [25]. The financial capital is there – it simply needs to be mobilized.
To learn more about the potential and ongoing technological developments of wind energy, listen to our full interview with Simon Watson in our Climate Now podcast. You can find our podcasts and other videos at our website, ClimateNow.com.
Thanks and see you next time!
Sources
- 00:13, 2:15, 3:02 Pasqualetti, M., et al. (2004) History of Wind Energy. In: Encyclopedia of Energy, Volume 6. C.J. Cleveland, Ed. Elsevier, p. 419-433.
- 00:18 International Energy Agency (2021) World Energy Outlook 2021. p. 320. https://www.iea.org/reports/world-energy-outlook-2021
- 00:18 Larson, E., et al. (2021) Net-Zero America: Potential Pathways, Infrastructure, and Impacts. Final Report, Princeton University, Princeton, NJ. Slides 88-149. https://netzeroamerica.princeton.edu/the-report
- 00:23 BP Statistical Review of World Energy – 2021. p. 10-13, 63, 65 https://www.bp.com/en/global/corporate/energy-economics/statistical-review-of-world-energy.html. % Global electricity from wind in 2020 = 100*(1591.2 TWh wind electricity generation)/(26823.2 TWh total electricity generation) = 5.9%. % Global electricity from renewables in 2020 100*(3147.0 TWh renewable)/(26823.2 TWh total) = 11.7%
- 00:38, 7:16, 8:47, 9:37, 11:34 Lee, J., F. Zhao, et al. (2021) Global Wind Report 2021. Global Wind Energy Council. p. 11. https://gwec.net/global-wind-report-2021/
- 00:38, 00:47, 1:00, 11:21 New Energy Outlook 2021. BloombergNEF. Published online (no date). Accessed December 5, 2021. https://about.bnef.com/new-energy-outlook/ Green scenario projects 121,500TWh annual global electricity, from 70% wind+solar, 62% of that is wind = 52,731 TWh wind energy. That is 33x more than the 1590.19 TWh wind energy consumed in 2020 (BP – 2021).
- 1:14 Energy Data Explorer: Wind Power Generation. Our World in Data. Published online (no date). Accessed December 5, 2021. https://ourworldindata.org/explorers/energy?tab=chart&facet=none&country=~OWID_WRL&Total+or+Breakdown=Select+a+source&Select+a+source=Wind&Energy+or+Electricity=Electricity+only&Metric=Annual+generation. In 1990: 3.63TWh, in 2020: 1590.19TWh. = 438x higher.
- 1:52 Image from http://xn--drmstrre-64ad.dk/wp-content/wind/miller/windpower%20web/en/pictures/lacour.htm
- 01:58, 2:06 Price, T.J. (2005) James Blyth – Britain’s first modern wind power pioneer. Wind Engineering, 29(3), 191-200. https://doi.org/10.1260%2F030952405774354921
- 2:04, 4:15 Shahan, Z. History of Wind Turbines. Renewable Energy World. Published online (November 21, 2014). Accessed December 5, 2021. https://www.renewableenergyworld.com/storage/history-of-wind-turbines/#gref
- 2:07, 2:13, 2:25 History of Wind Turbines. Danish Wind Industry Association. Published online (updated June 6, 2003). Accessed December 5, 2021. http://xn--drmstrre-64ad.dk/wp-content/wind/miller/windpower%20web/en/pictures/index.htm
- 2:28 Average US home uses 867 kWh/month → 867kWh/1month = 867kWh/730h = 1.19kW. 20-35kW turbine could power 17-30 homes. How much wind energy does it take to power an average home? USGS. Published online (no date). Accessed December 5, 2021. https://www.usgs.gov/faqs/how-much-wind-energy-does-it-take-power-average-home?qt-news_science_products=0#qt-news_science_products
- 2:43, 3:22, 3:35, 4:09 Hau, E. (2013) Wind Turbines: Fundamentals, Technologies, Application, Economics. Berlin, Heidelberg: Springer-Verlag.
- 2:02 Storing wind power. Poul la Cour Museet. Published online (no date). Accessed December 5, 2021. https://www.poullacour.dk/en/storing-wind-power/
- 3:14 Jones, G. and Bouamane, L. (2011). Historical trajectories and corporate competences in wind energy. Harvard Business School Working Paper 11-112. https://papers.ssrn.com/sol3/papers.cfm?abstract_id=1831471. p. 18.
- 3:51 Crude oil prices – 70 year historical chart. Macrotrends. Published online (no date). Accessed December 05, 2021. https://www.macrotrends.net/1369/crude-oil-price-history-chart Coal prices: McNerney et al. (2011), Fig. 9
- 3:51, 4:03, 6:05 Levelized cost of energy by technology. Our World in Data. Published online (no date). Accessed December 05, 2021. Normalized for inflation. https://ourworldindata.org/grapher/levelized-cost-of-energy?country=~OWID_WRL
- 4:08 Image by Dirk Ingo Franke licensed under CC BY-SA 3.0
- 4:13 Image by S.J. de Waard licensed under CC BY-SA 2.0
- 4:30 Global Wind Atlas. Published online (2021). Accessed December 19, 2021. https://globalwindatlas.info/
- 4:37 U.S. Wind Power Technology Trends 1998-2017. WINDExchange. Published online (no date). Accessed December 05, 2021. https://windexchange.energy.gov/maps-data/336
- 4:37, 4:43, 4:54, 6:25, 6:36, 6:56 Wind Turbines: the Bigger, the Better. Office of Energy Efficiency & Renewable Energy. Published online (August 30, 2021). Accessed December 05, 2021. https://www.energy.gov/eere/articles/wind-turbines-bigger-better
- 5:24 Roser, M. Why did renewables become so cheap so fast? Our World in Data. Published online (December 01, 2020, last updated August 21, 2021). Accessed December 05, 2021. https://ourworldindata.org/cheap-renewables-growth
- 5:38, 6:01 Lazard (2021) Lazard’s levelized cost of energy analysis – Version 15.0. https://www.lazard.com/perspective/levelized-cost-of-energy-levelized-cost-of-storage-and-levelized-cost-of-hydrogen/ In 2010 mean unsubsidized LCOE in the U.S. for wind was $124 USD/MWh, for coal was $111. In 2011, wind was $83, coal was $111.
- 5:55, 7:22, 8:38, 11:54, 12:27, 13:08, 13:25,13:38 IRENA (2021) World Energy Transitions Outlook: 1.5 C Pathway, International REnewable Energy Agency, Aby Dhabi https://irena.org/publications/2021/Jun/World-Energy-Transitions-Outlook
- 6:05 IRENA (2021a) Renewable power generation costs in 2020. International Renewable Energy Agency, Abu Dhabi. https://www.irena.org/publications/2021/Jun/Renewable-Power-Costs-in-2020 p. 11
- 6:56 Offshore wind research and development. Wind Energy Technologies Office: US Department of Energy. Published online (no date). Accessed December 05, 2021. https://www.energy.gov/eere/wind/offshore-wind-research-and-development
- 7:05, 8:30, 9:17, 9:27, 10:03. 10:25, 12:43, 12:50 IRENA (2019), Future of wind: Deployment, investment, technology, grid integration and socio-economic aspects (A Global Energy Transformation paper), International Renewable Energy Agency, Abu Dhabi. https://www.irena.org/publications/2019/Oct/Future-of-wind
- 9:00 Evans, S. Wind and solar are 30-50% cheaper than thought, admits UK government. CarbonBrief. Published online August 27, 2020. Accessed December 05, 2021. https://www.carbonbrief.org/wind-and-solar-are-30-50-cheaper-than-thought-admits-uk-government
- 9:20 Image by Untrakdrover licensed under CC BY-SA 3.0
- 9:33 Photo: Øyvind Gravås/Woldcam – Equinor ASA
- 10:08 Image by Olivierabristol licensed under CC BY-SA 4.0 International
- 10:25 Cassauwers, T. Energy kites are the soaring alternative to windmills. Sierra: The Magazine of the Sierra Club. Published online September 7, 2020. Accessed December 05, 2021. https://www.sierraclub.org/sierra/2020-5-september-october/innovate/energy-kites-are-soaring-alternative-windmills
- 10:48 New lab report: How to cut the cost of wind energy in half. Office of Energy Efficiency & Renewable Energy: US Department of Energy. Published online August 23, 2017. Accessed December 05, 2021. https://www.energy.gov/eere/articles/new-lab-report-how-cut-cost-wind-energy-half
- 10:48, 10:58 Seda, M. Engineering, data science and mathematical models to optimize wind energy farms. Rutgers Institute of Earth, Ocean, and Atmospheric Sciences. Published online November 29, 2021. Accessed December 05, 2021. https://eoas.rutgers.edu/engineering-data-science-and-mathematical-models-to-optimize-wind-energy-farms/
- 12:55 Ritchie, H. The price of batteries has declined by 97% in the last three decades. Our World in Data. Published online June 04, 2021. Accessed January 28, 2022. https://ourworldindata.org/battery-price-decline
- 12:58 Calma, J. The US offshore wind boom will depend on these ships. The Verge. Published online February 23, 2021. Accessed January 28, 2022. https://www.theverge.com/22296979/us-offshore-ships-wind-boom-installation-vessels